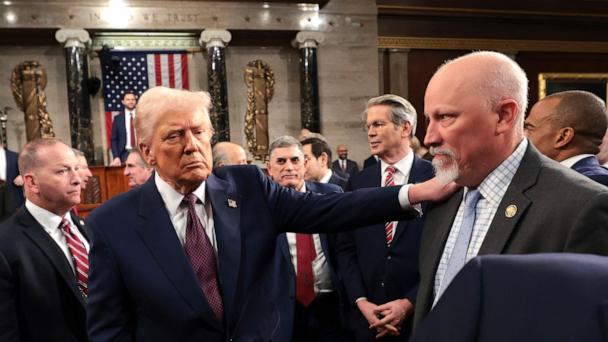
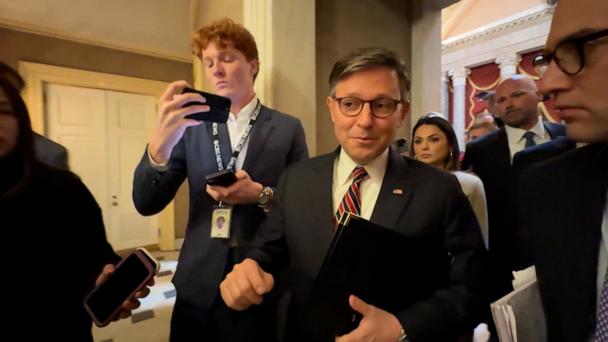
Speaker Mike Johnson met Tuesday at the White House with President Donald Trump and House Republicans holding out against voting for the Senate-approved budget bill to fund Trump's agenda.
The move lower on Tuesday resumed a selloff that stretches back to Trump's tariff announcement last week. Since then, the S&P 500 and Nasdaq have each fallen more than 12%.
Vice Adm. Shoshana Chatfield, who is assigned to NATO’s Military Committee in Brussels, was fired over the weekend, two U.S. officials confirmed to ABC News.
The Supreme Court said the Trump administration can move forward with the termination of thousands of probationary workers across six federal agencies and departments.
Rep. Katherine Clark, D-Mass., says “Republicans are nowhere to be found” when it comes to trying to rein in President Donald Trump’s authority to impose tariffs.
ABC News’ Mary Bruce asked Treasury Secretary Scott Bessent on Tuesday morning how soon he thinks deals can be made with other nations as some tariff negotiations begin.
The Supreme Court in a 5-4 decision Monday evening allowed Trump to resume deportations under the Alien Enemies Act, but said detainees must be given due process to challenge their removal.
President Trump and Netanyahu discussed Israel's war with Hamas and the tariffs that the U.S. imposed on virtually all of its trading partners, which have sent world markets reeling.
Chief Justice John Roberts has issued a temporary administrative stay -- putting off a deadline for the government to return a mistakenly deported man to the U.S.
As fallout continues from Trump's severe tariff policy on virtually all U.S. trading partners, some GOP senators are warning about the risks for American families.
Cynthia Travieso, director of power building at Community Change Action, discusses why over 1,200 protests are unfolding across the country against the Trump administration's policies.
Hundreds of students from some of the largest schools in the D.C. area will rally outside the Department of Education Friday to oppose the gutting of the agency.
Former Vice President Kamala Harris spoke Thursday at the Leading Women Defined Summit, where she framed actions by the current White House as unconstitutional.