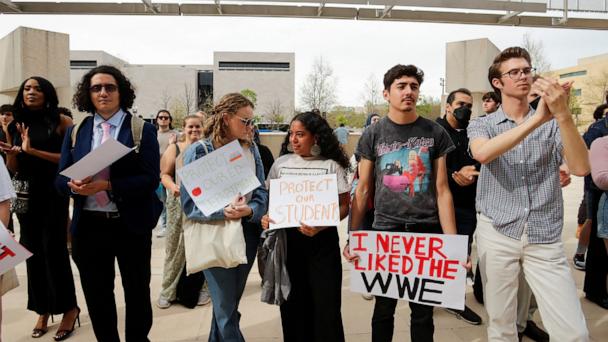
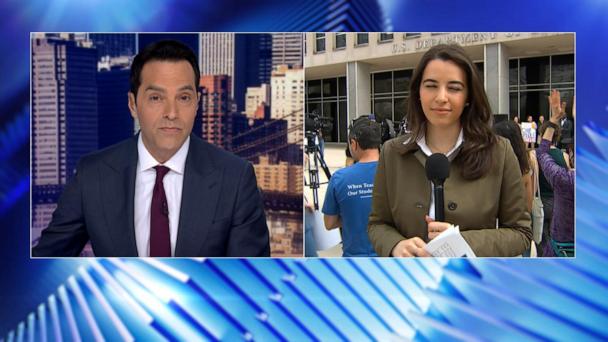
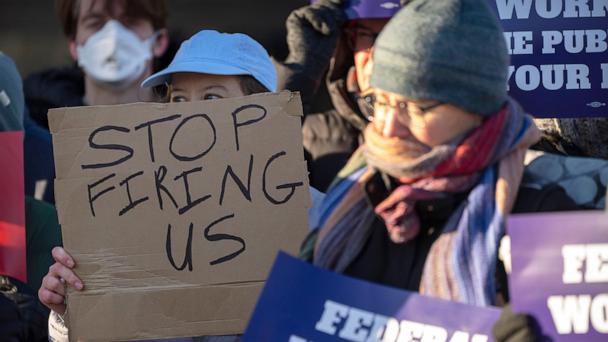
Hundreds of students from some of the largest schools in the D.C. area will rally outside the Department of Education Friday to oppose the gutting of the agency.
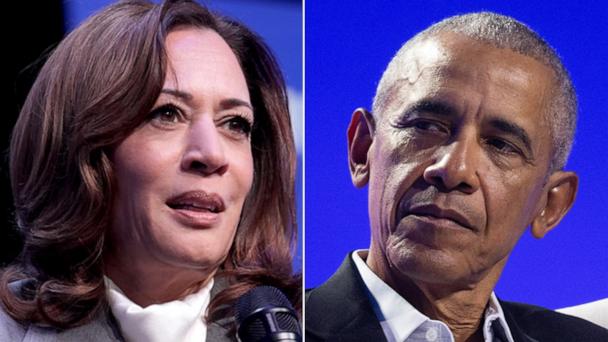
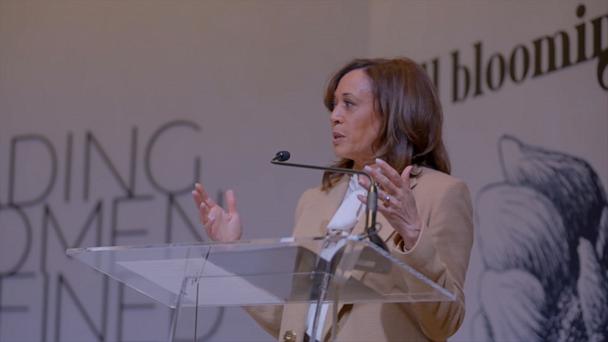
Former Vice President Kamala Harris spoke Thursday at the Leading Women Defined Summit, where she framed actions by the current White House as unconstitutional.
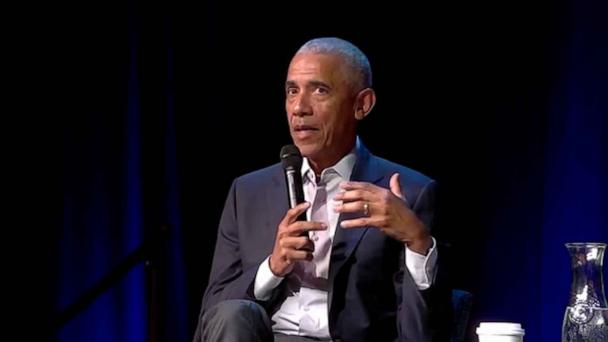
Former President Barack Obama delivered remarks on Thursday at Hamilton College, in which he urged citizens to stand up for American ideals such as equality and the rule of law.
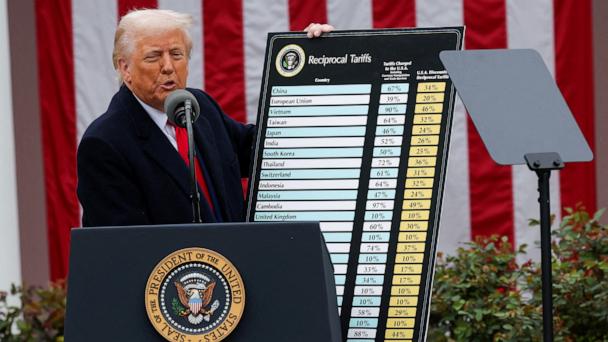
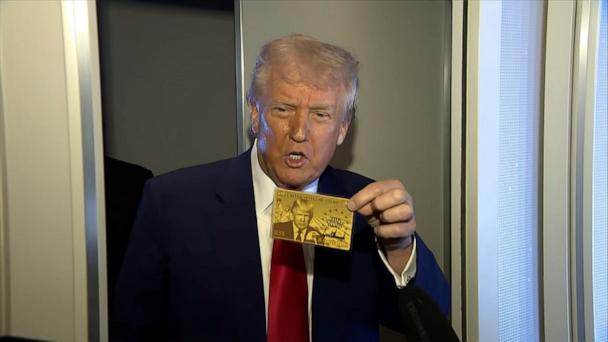
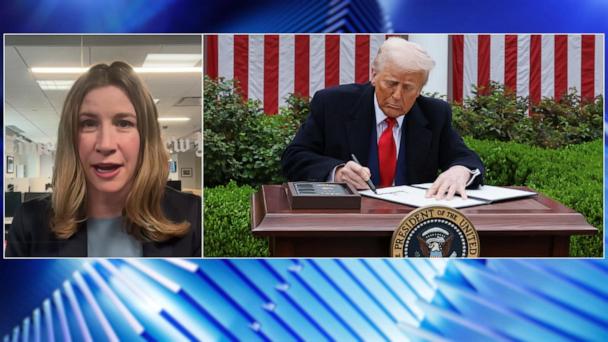
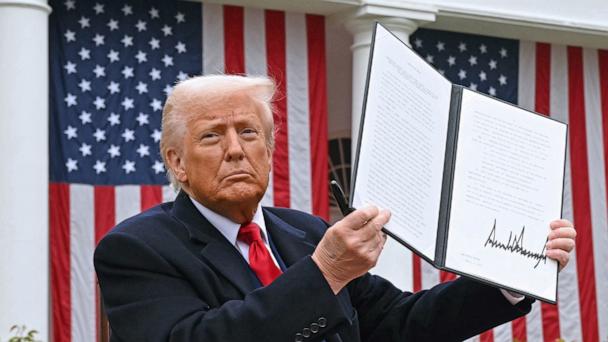
Ted Rossman, senior industry analyst at Bankrate, discusses the continued fallout after President Trump's unveiling of tariffs against virtually all U.S. trading partners.
Patrick Kummrow, who owns an auto repair shop, discusses how his business fared during past recessions and how he expects President Trump's tariffs to affect it now.
ABC News’ Luis Martinez and Katherine Faulders report on the conspiracy theorist’s comments related to high-profile firings at the National Security Agency.
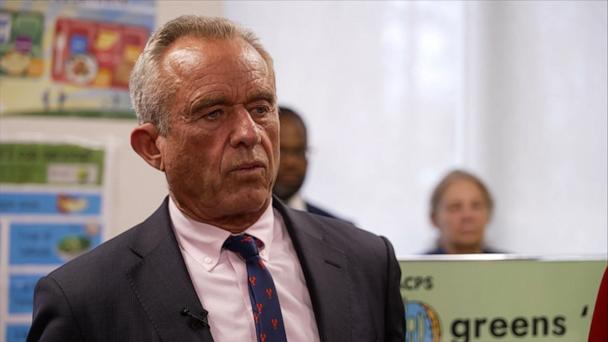
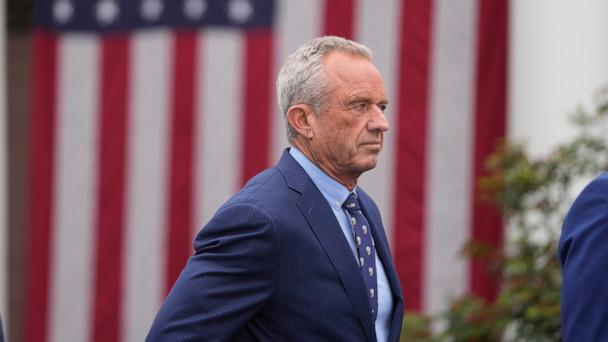
On the heels of terminating 10,000 jobs from the HHS, Robert F. Kennedy Jr. told ABC News some programs would soon be reinstated because they were mistakenly cut.
Joseph Foudy, an economics professor at New York University’s Stern School of Business, discusses how other countries may retaliate against the Trump administration’s tariff plan.
Director of The Budget Lab at Yale, Ernie Tedeschi, estimates a loss of $3,800 per household as a result of the tariffs imposed by President Donald Trump.
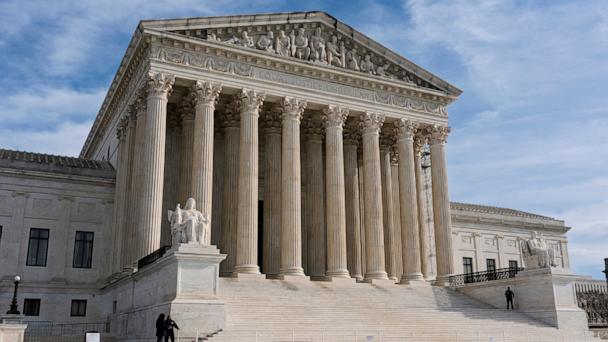
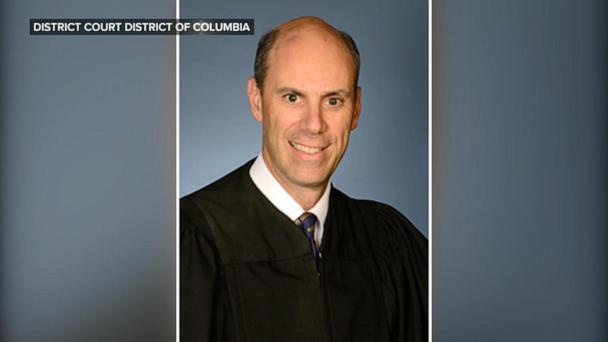
A judge will hear arguments Thursday over whether the Trump administration defied a court order when they deported alleged migrant gang members to El Salvador.
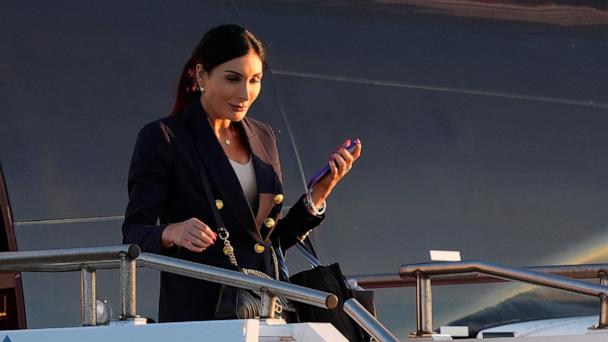
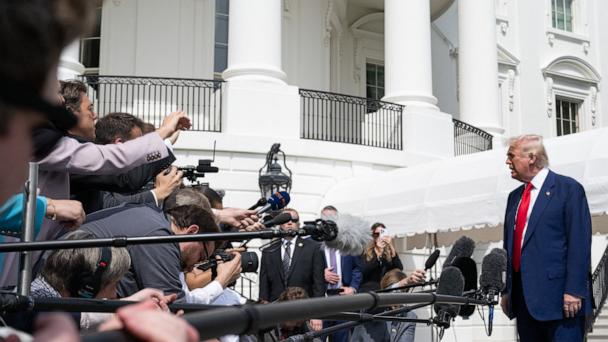
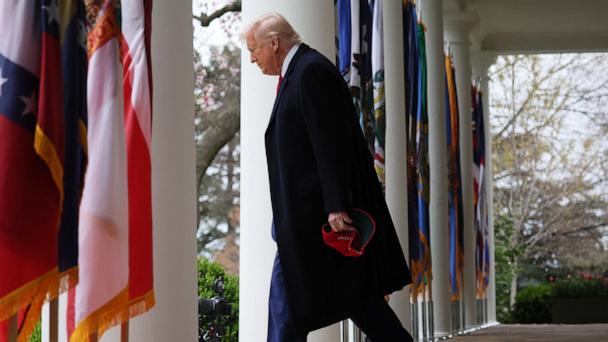
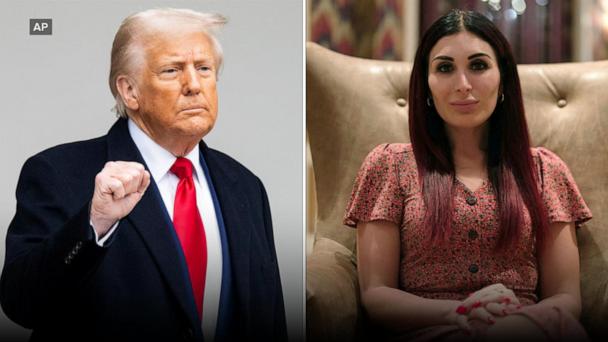
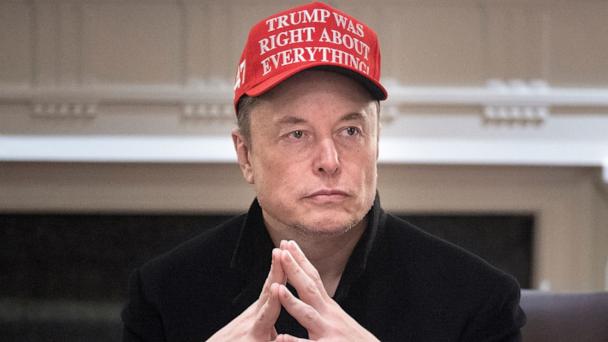
President Donald Trump fired the staffers after a meeting with far-right activist Laura Loomer, who claimed they were not committed to his agenda, sources told ABC News.
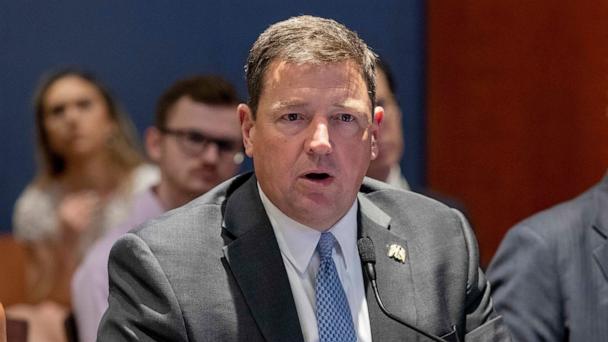
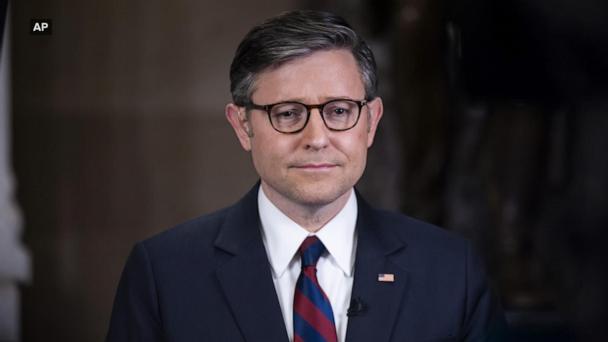
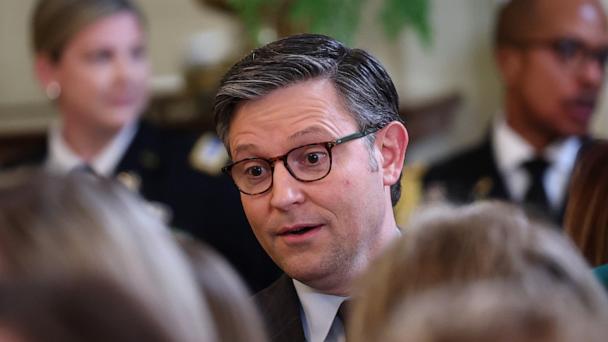
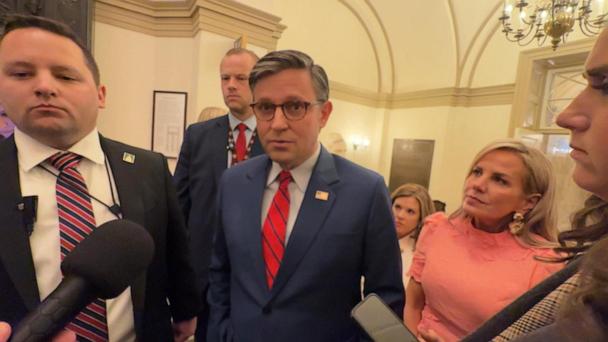
With the House at a standstill, Speaker Mike Johnson is refusing to fold on his strong opposition to allowing new parents in Congress to vote remotely.
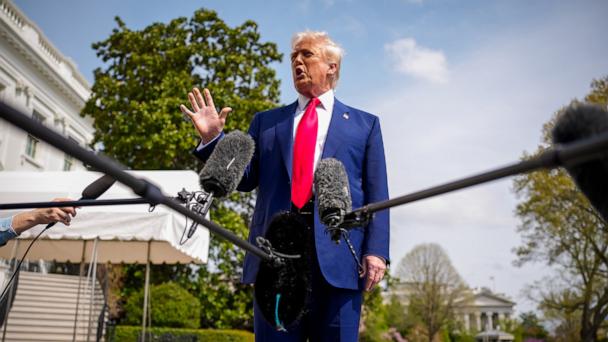
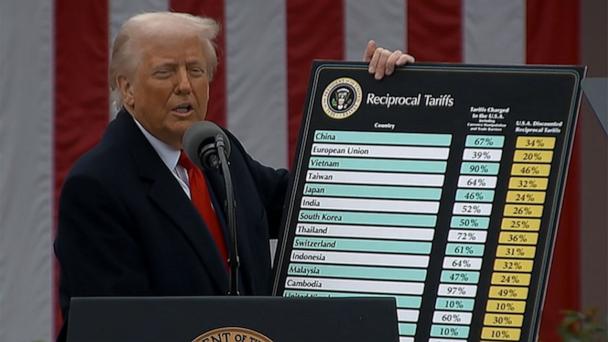
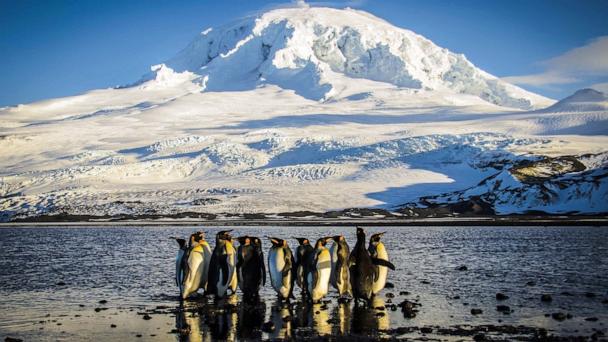
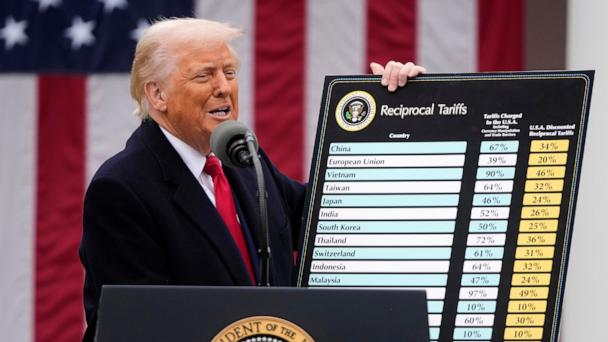
President Trump's sweeping new set of tariffs impact friends and foe alike, but also on the list are uninhabited islands while glaring omissions include Russia and Iran.
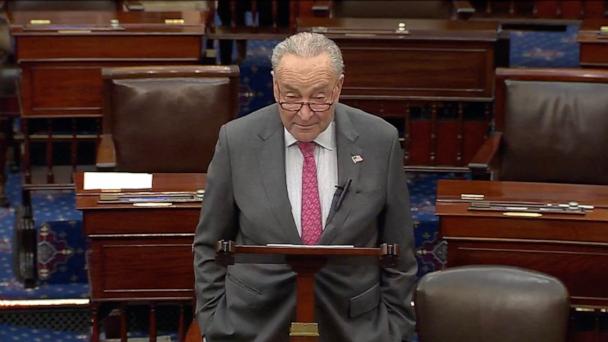
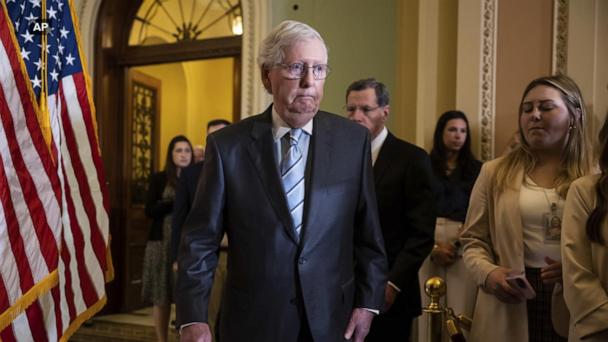
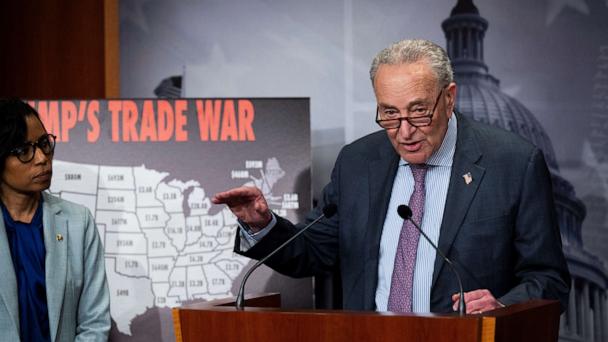
A bipartisan group of senators passed a resolution to end the national emergency declaration against Canada and cut down President Donald Trump’s tariff authority. ABC News’ Jay O’Brien reports.
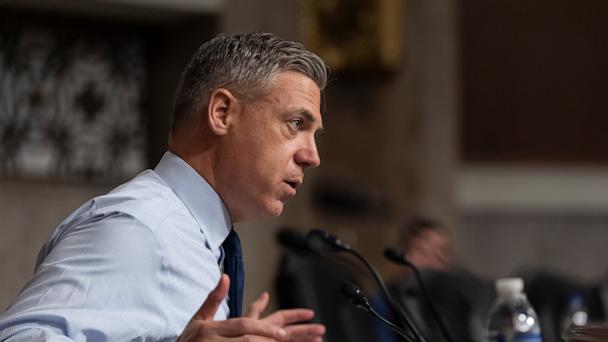
A video of Sen. Jim Banks telling a man on Capitol Hill who identified himself as a recently fired HHS employee that he "probably deserved it" because "you seem like a clown" has gone viral.