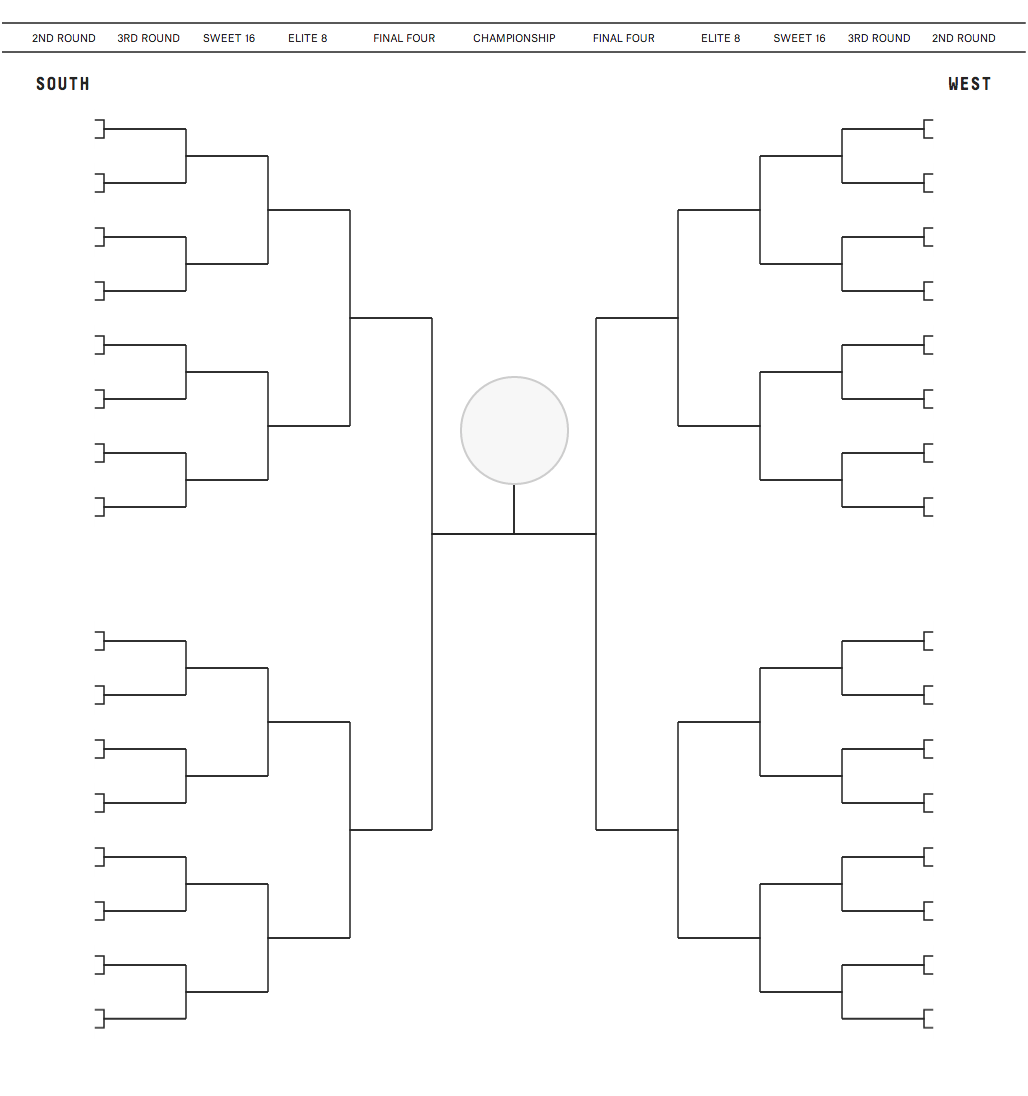
Hover over each spot to see the team most likely to get there
Design and development by Matthew Conlen, Ritchie King, Allison McCann and Andrei Scheinkman. Statistical model by Nate Silver. Download this data. Report any bugs.
| Chance of Reaching Round | ||||||||||
|---|---|---|---|---|---|---|---|---|---|---|
| Region | Seed | Team | 2nd | 3rd | Sweet 16 | Elite 8 | Final 4 | Champ. | Win | |
| Midwest | 4 |  | Louisville | √ | 93% | 78% | 54% | 38% | 24% | 15% |
| South | 1 |  | Florida | √ | 99% | 84% | 62% | 41% | 26% | 14% |
| West | 1 |  | Arizona | √ | 98% | 73% | 58% | 42% | 23% | 13% |
| South | 2 |  | Kansas | √ | 92% | 67% | 42% | 21% | 12% | 6% |
| East | 1 |  | Virginia | √ | 96% | 71% | 39% | 23% | 12% | 6% |
| East | 4 |  | Michigan State | √ | 91% | 67% | 39% | 24% | 12% | 6% |
| Midwest | 3 |  | Duke | √ | 93% | 70% | 43% | 18% | 9% | 5% |
| Midwest | 1 |  | Wichita State | √ | 98% | 59% | 24% | 14% | 8% | 5% |
| East | 2 |  | Villanova | √ | 95% | 64% | 41% | 21% | 9% | 4% |
| West | 2 |  | Wisconsin | √ | 93% | 72% | 40% | 16% | 7% | 3% |
| Midwest | 2 |  | Michigan | √ | 95% | 74% | 37% | 14% | 6% | 3% |
| West | 3 |  | Creighton | √ | 88% | 54% | 30% | 12% | 5% | 3% |
| Midwest | 8 |  | Kentucky | √ | 74% | 34% | 14% | 8% | 4% | 2% |
| South | 6 |  | Ohio State | √ | 75% | 40% | 20% | 9% | 4% | 2% |
| South | 4 |  | UCLA | √ | 87% | 63% | 19% | 8% | 4% | 1% |
| South | 3 |  | Syracuse | √ | 89% | 50% | 23% | 9% | 4% | 1% |
| East | 3 |  | Iowa State | √ | 81% | 46% | 20% | 8% | 3% | 1% |
| West | 9 |  | Oklahoma State | √ | 52% | 14% | 9% | 5% | 2% | 1% |
| East | 6 |  | North Carolina | √ | 68% | 36% | 16% | 6% | 2% | <1% |
| West | 6 |  | Baylor | √ | 70% | 34% | 14% | 4% | 2% | <1% |
| South | 5 |  | Virginia Commonwealth | √ | 76% | 29% | 10% | 4% | 2% | <1% |
| West | 4 |  | San Diego State | √ | 73% | 43% | 14% | 7% | 2% | <1% |
| East | 7 |  | Connecticut | √ | 67% | 26% | 14% | 6% | 2% | <1% |
| West | 8 |  | Gonzaga | √ | 48% | 13% | 8% | 4% | 1% | <1% |
| South | 7 |  | New Mexico | √ | 64% | 22% | 10% | 3% | 1% | <1% |
| West | 5 |  | Oklahoma | √ | 64% | 33% | 8% | 3% | 1% | <1% |
| South | 9 |  | Pittsburgh | √ | 72% | 14% | 7% | 3% | 1% | <1% |
| East | 5 |  | Cincinnati | √ | 58% | 19% | 8% | 3% | 1% | <1% |
| West | 7 |  | Oregon | √ | 65% | 19% | 10% | 4% | 1% | <1% |
| Midwest | 11b |  | Tennessee | 52% | 36% | 12% | 6% | 2% | <1% | <1% |
| Midwest | 11a |  | Iowa | 48% | 32% | 9% | 5% | 2% | <1% | <1% |
| East | 8 |  | Memphis | √ | 55% | 17% | 6% | 2% | <1% | <1% |
| Midwest | 5 |  | Saint Louis | √ | 58% | 12% | 4% | 2% | <1% | <1% |
| East | 12 |  | Harvard | √ | 42% | 12% | 4% | 2% | <1% | <1% |
| East | 9 |  | George Washington | √ | 45% | 12% | 4% | 1% | <1% | <1% |
| Midwest | 7 |  | Texas | √ | 50% | 13% | 3% | <1% | <1% | <1% |
| East | 11 |  | Providence | √ | 32% | 12% | 4% | 1% | <1% | <1% |
| South | 10 |  | Stanford | √ | 36% | 9% | 3% | <1% | <1% | <1% |
| Midwest | 10 |  | Arizona State | √ | 50% | 13% | 3% | <1% | <1% | <1% |
| Midwest | 9 |  | Kansas State | √ | 26% | 7% | 1% | <1% | <1% | <1% |
| Midwest | 12b |  | Xavier | 64% | 28% | 5% | 2% | <1% | <1% | <1% |
| West | 11 |  | Nebraska | √ | 30% | 9% | 3% | <1% | <1% | <1% |
| East | 10 |  | Saint Joseph's | √ | 33% | 8% | 3% | <1% | <1% | <1% |
| South | 11 |  | Dayton | √ | 25% | 8% | 2% | <1% | <1% | <1% |
| West | 10 |  | Brigham Young | √ | 35% | 7% | 3% | <1% | <1% | <1% |
| Midwest | 6 |  | Massachusetts | √ | 32% | 6% | 2% | <1% | <1% | <1% |
| West | 12 |  | North Dakota State | √ | 36% | 15% | 2% | <1% | <1% | <1% |
| South | 8 |  | Colorado | √ | 28% | 2% | <1% | <1% | <1% | <1% |
| West | 13 |  | New Mexico State | √ | 27% | 10% | 1% | <1% | <1% | <1% |
| South | 13 |  | Tulsa | √ | 13% | 4% | <1% | <1% | <1% | <1% |
| South | 12 |  | Stephen F. Austin | √ | 24% | 4% | <1% | <1% | <1% | <1% |
| Midwest | 12a |  | North Carolina State | 36% | 15% | 2% | <1% | <1% | <1% | <1% |
| East | 14 |  | North Carolina Central | √ | 19% | 5% | 1% | <1% | <1% | <1% |
| Midwest | 13 |  | Manhattan | √ | 7% | 3% | <1% | <1% | <1% | <1% |
| East | 13 |  | Delaware | √ | 9% | 2% | <1% | <1% | <1% | <1% |
| Midwest | 14 |  | Mercer | √ | 7% | 2% | <1% | <1% | <1% | <1% |
| South | 14 |  | Western Michigan | √ | 11% | 2% | <1% | <1% | <1% | <1% |
| West | 14 |  | Louisiana-Lafayette | √ | 12% | 3% | <1% | <1% | <1% | <1% |
| South | 15 |  | Eastern Kentucky | √ | 8% | 2% | <1% | <1% | <1% | <1% |
| West | 15 |  | American University | √ | 7% | 2% | <1% | <1% | <1% | <1% |
| East | 15 |  | Milwaukee | √ | 5% | <1% | <1% | <1% | <1% | <1% |
| West | 16 |  | Weber State | √ | 2% | <1% | <1% | <1% | <1% | <1% |
| Midwest | 15 |  | Wofford | √ | 5% | 1% | <1% | <1% | <1% | <1% |
| East | 16 |  | Coastal Carolina | √ | 4% | <1% | <1% | <1% | <1% | <1% |
| South | 16a |  | Albany | 52% | <1% | <1% | <1% | <1% | <1% | <1% |
| South | 16b |  | Mount St. Mary's | 48% | <1% | <1% | <1% | <1% | <1% | <1% |
| Midwest | 16a |  | Cal Poly | 56% | 1% | <1% | <1% | <1% | <1% | <1% |
| Midwest | 16b |  | Texas Southern | 44% | <1% | <1% | <1% | <1% | <1% | <1% |
| Chance of Reaching | |||||||
|---|---|---|---|---|---|---|---|
| 2nd | 3rd | Sweet 16 | Elite 8 | Final 4 | Champ | Win | |
| Louisville | √ | 93% | 78% | 54% | 38% | 24% | 15% |
| Florida | √ | 99% | 84% | 62% | 41% | 26% | 14% |
| Arizona | √ | 98% | 73% | 58% | 42% | 23% | 13% |
| Kansas | √ | 92% | 67% | 42% | 21% | 12% | 6% |
| Virginia | √ | 96% | 71% | 39% | 23% | 12% | 6% |
| MSU | √ | 91% | 67% | 39% | 24% | 12% | 6% |
| Duke | √ | 93% | 70% | 43% | 18% | 9% | 5% |
| Wichita St. | √ | 98% | 59% | 24% | 14% | 8% | 5% |
| Villanova | √ | 95% | 64% | 41% | 21% | 9% | 4% |
| Wisconsin | √ | 93% | 72% | 40% | 16% | 7% | 3% |
| Michigan | √ | 95% | 74% | 37% | 14% | 6% | 3% |
| Creighton | √ | 88% | 54% | 30% | 12% | 5% | 3% |
| Kentucky | √ | 74% | 34% | 14% | 8% | 4% | 2% |
| Ohio State | √ | 75% | 40% | 20% | 9% | 4% | 2% |
| UCLA | √ | 87% | 63% | 19% | 8% | 4% | 1% |
| Syracuse | √ | 89% | 50% | 23% | 9% | 4% | 1% |
| Iowa State | √ | 81% | 46% | 20% | 8% | 3% | 1% |
| Okla. State | √ | 52% | 14% | 9% | 5% | 2% | 1% |
| UNC | √ | 68% | 36% | 16% | 6% | 2% | <1% |
| Baylor | √ | 70% | 34% | 14% | 4% | 2% | <1% |
| VCU | √ | 76% | 29% | 10% | 4% | 2% | <1% |
| S.D. State | √ | 73% | 43% | 14% | 7% | 2% | <1% |
| Connecticut | √ | 67% | 26% | 14% | 6% | 2% | <1% |
| Gonzaga | √ | 48% | 13% | 8% | 4% | 1% | <1% |
| New Mexico | √ | 64% | 22% | 10% | 3% | 1% | <1% |
| Oklahoma | √ | 64% | 33% | 8% | 3% | 1% | <1% |
| Pittsburgh | √ | 72% | 14% | 7% | 3% | 1% | <1% |
| Cincinnati | √ | 58% | 19% | 8% | 3% | 1% | <1% |
| Oregon | √ | 65% | 19% | 10% | 4% | 1% | <1% |
| Tennessee | 52% | 36% | 12% | 6% | 2% | <1% | <1% |
| Iowa | 48% | 32% | 9% | 5% | 2% | <1% | <1% |
| Memphis | √ | 55% | 17% | 6% | 2% | <1% | <1% |
| St. Louis | √ | 58% | 12% | 4% | 2% | <1% | <1% |
| Harvard | √ | 42% | 12% | 4% | 2% | <1% | <1% |
| GW | √ | 45% | 12% | 4% | 1% | <1% | <1% |
| Texas | √ | 50% | 13% | 3% | <1% | <1% | <1% |
| Providence | √ | 32% | 12% | 4% | 1% | <1% | <1% |
| Stanford | √ | 36% | 9% | 3% | <1% | <1% | <1% |
| Arizona St. | √ | 50% | 13% | 3% | <1% | <1% | <1% |
| Kansas St. | √ | 26% | 7% | 1% | <1% | <1% | <1% |
| Xavier | 64% | 28% | 5% | 2% | <1% | <1% | <1% |
| Nebraska | √ | 30% | 9% | 3% | <1% | <1% | <1% |
| St. Joseph's | √ | 33% | 8% | 3% | <1% | <1% | <1% |
| Dayton | √ | 25% | 8% | 2% | <1% | <1% | <1% |
| BYU | √ | 35% | 7% | 3% | <1% | <1% | <1% |
| UMass | √ | 32% | 6% | 2% | <1% | <1% | <1% |
| N.D. State | √ | 36% | 15% | 2% | <1% | <1% | <1% |
| Colorado | √ | 28% | 2% | <1% | <1% | <1% | <1% |
| N.M. State | √ | 27% | 10% | 1% | <1% | <1% | <1% |
| Tulsa | √ | 13% | 4% | <1% | <1% | <1% | <1% |
| SF Austin | √ | 24% | 4% | <1% | <1% | <1% | <1% |
| N.C. State | 36% | 15% | 2% | <1% | <1% | <1% | <1% |
| NCCU | √ | 19% | 5% | 1% | <1% | <1% | <1% |
| Manhattan | √ | 7% | 3% | <1% | <1% | <1% | <1% |
| Delaware | √ | 9% | 2% | <1% | <1% | <1% | <1% |
| Mercer | √ | 7% | 2% | <1% | <1% | <1% | <1% |
| W. Mich. | √ | 11% | 2% | <1% | <1% | <1% | <1% |
| La.-Lafayette | √ | 12% | 3% | <1% | <1% | <1% | <1% |
| E. Kentucky | √ | 8% | 2% | <1% | <1% | <1% | <1% |
| American | √ | 7% | 2% | <1% | <1% | <1% | <1% |
| Milwaukee | √ | 5% | <1% | <1% | <1% | <1% | <1% |
| Weber St. | √ | 2% | <1% | <1% | <1% | <1% | <1% |
| Wofford | √ | 5% | 1% | <1% | <1% | <1% | <1% |
| CCAR | √ | 4% | <1% | <1% | <1% | <1% | <1% |
| Albany | 52% | <1% | <1% | <1% | <1% | <1% | <1% |
| Mt. St. Mary's | 48% | <1% | <1% | <1% | <1% | <1% | <1% |
| Cal Poly | 56% | 1% | <1% | <1% | <1% | <1% | <1% |
| TXSO | 44% | <1% | <1% | <1% | <1% | <1% | <1% |