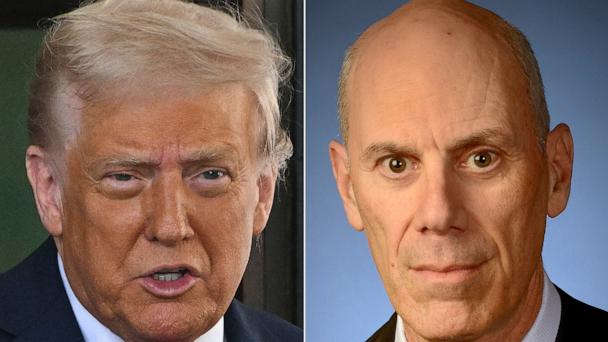
ABC News’ Stephanie Ramos speaks to NYU Law professor Rachel Barkow about a federal judge finding probable cause that the Trump administration acted in contempt of court.
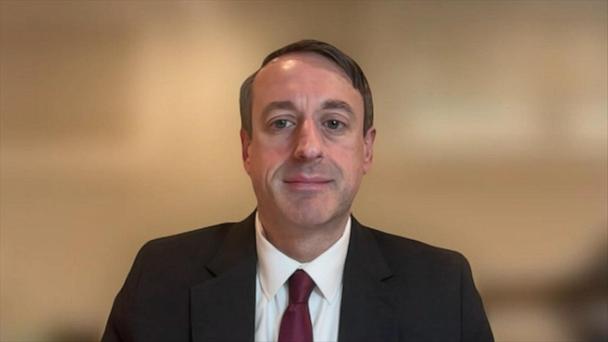
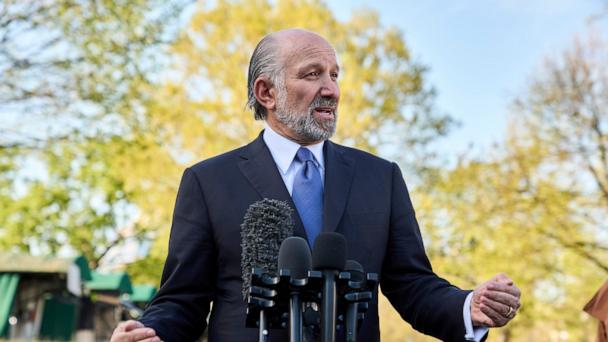
Senior counsel for Liberty Justice Center Jeffrey Schwab joins ABC News Live to discuss his firm representing a group of five small businesses that have filed a lawsuit against the president.
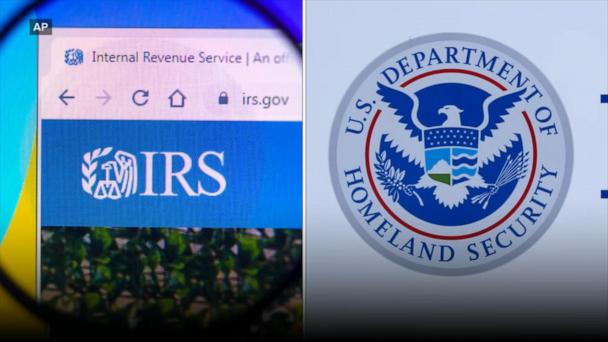
The IRS and Department of Homeland Security have reached a data-sharing agreement to support the Trump administration's immigration enforcement agenda, according to a court filing in early April.
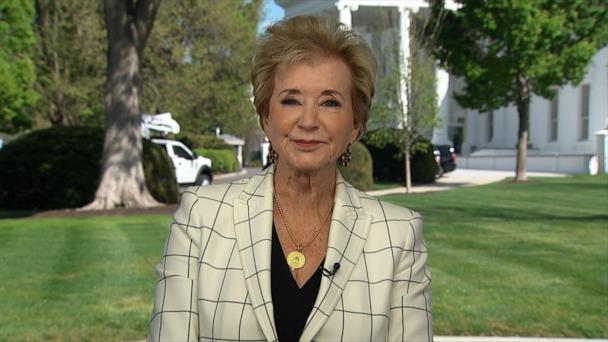
Education Secretary Linda McMahon reacts to Harvard rejecting the Trump administration's demands saying "we're not gonna have civil rights trampled on these colleges."
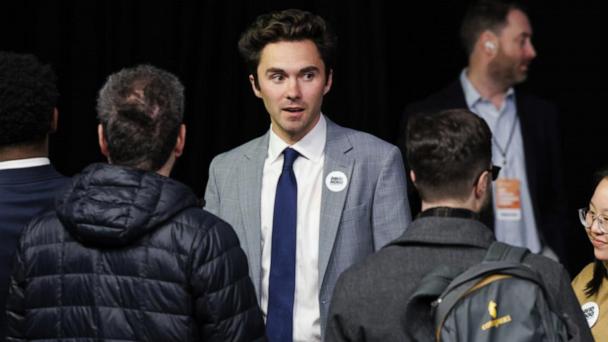
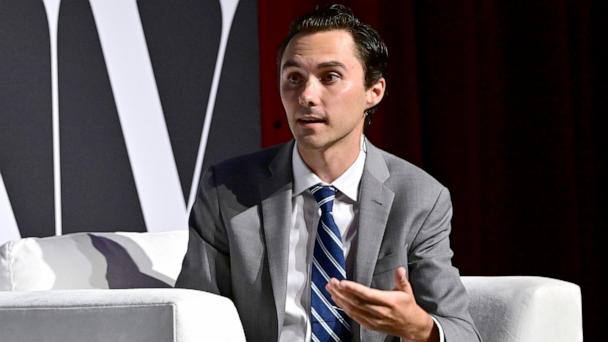
Leaders We Deserve, a group led by David Hogg, announced it will spend $20 million to help younger candidates and primary challengers to House Democrats.
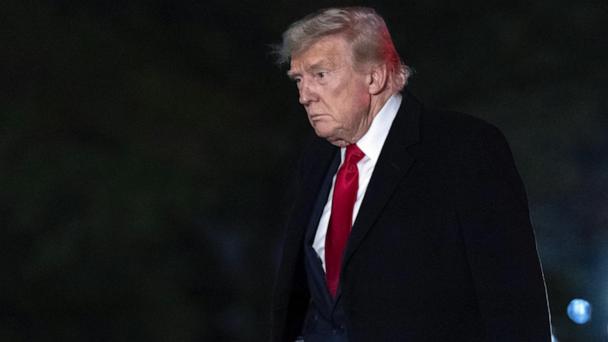
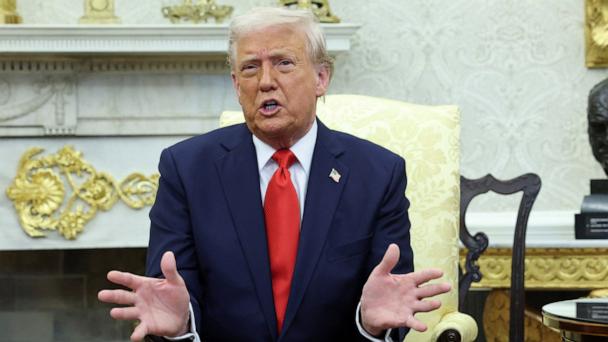
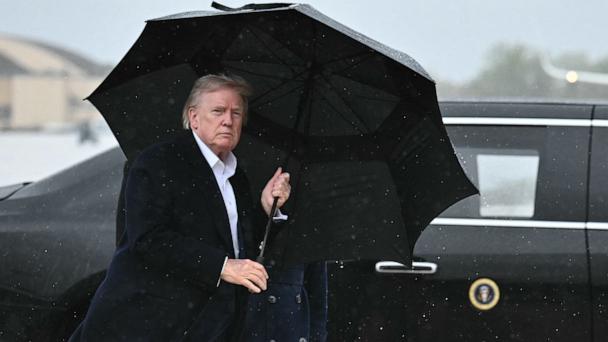
A judge found probable cause the Trump administration acted in contempt of court when officials defied his order to turn two planes around carrying alleged gang members.
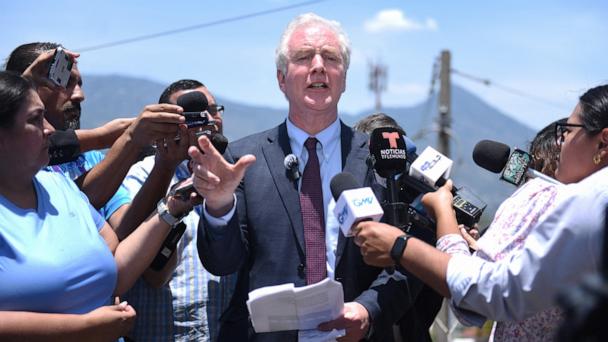
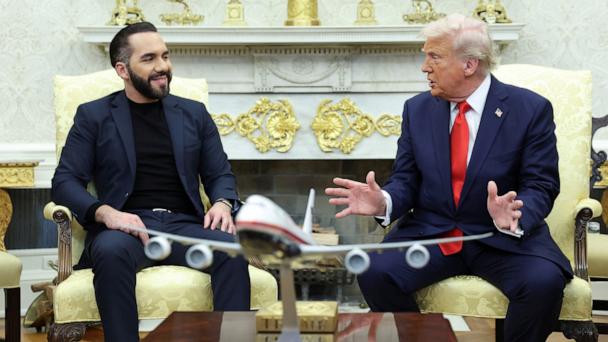
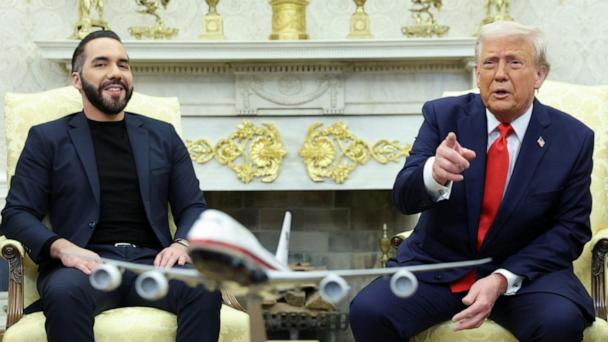
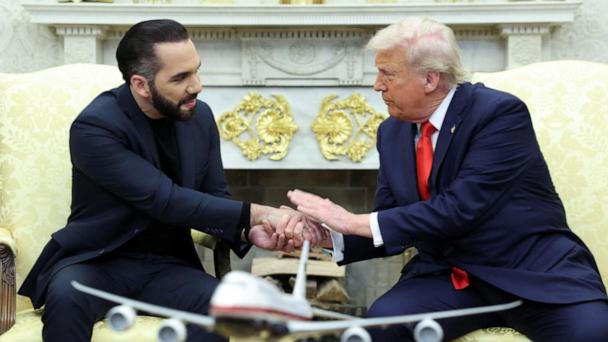
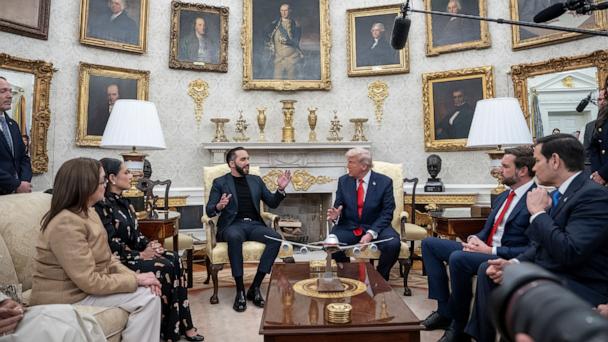
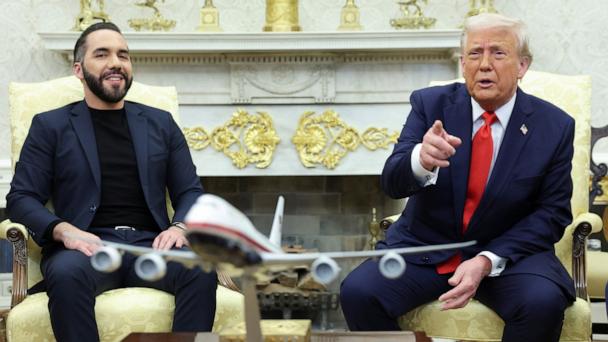
ABC News' Devin Dwyer and immigration attorney Leon Fresco react to President Trump's threats to send "homegrown criminals" to El Salvadoran prisons and his meeting with El Salvador's president.
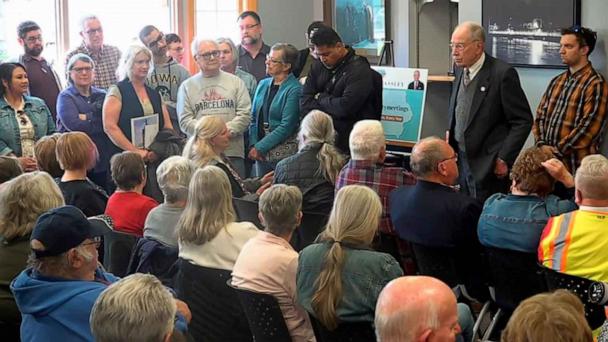
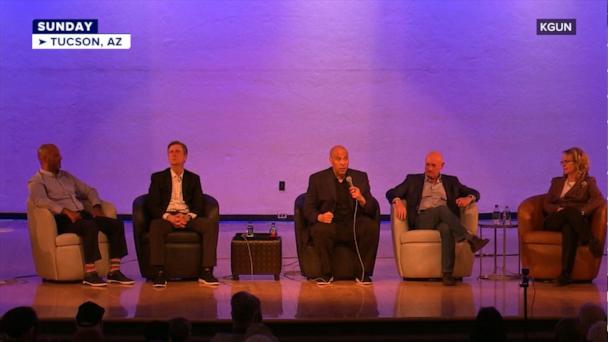
Sen. Chuck Grassley, R-Iowa, was grilled at a town hall in Iowa on Tuesday over concerns with the Trump administration’s deportation operation, tariff policies and government overreach.
Tricia McLaughlin, the assistant secretary of public affairs for the Department of Homeland Security, answers questions on recent Trump administration actions.
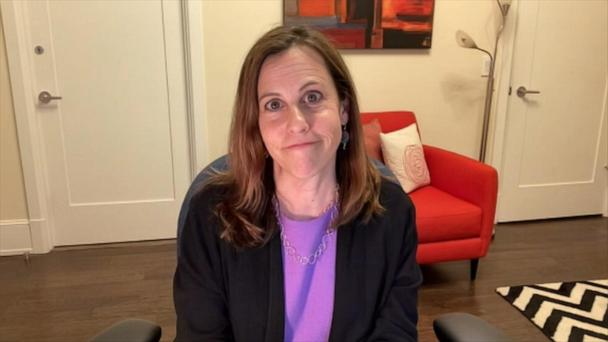
Amy Spitalnick, a Tufts alumna and CEO of the Jewish Council for Public Affairs, voiced concern about the Trump administration’s targeting of students in the name of antisemitism.
ABC News' Contributing Political Correspondent Rachael Bade discusses the Democratic Party doubling down on town hall meetings in Republican-held districts.
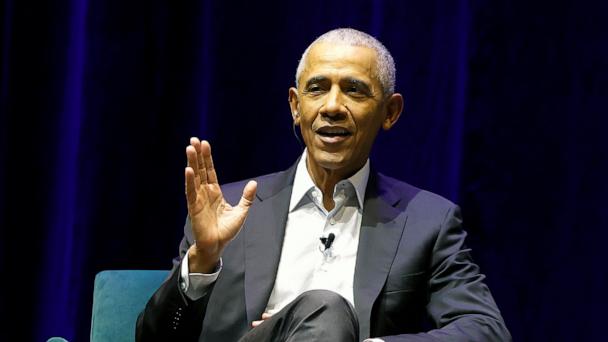
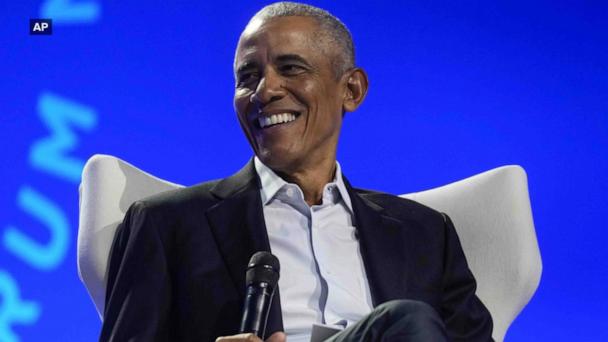
Barack Obama praised Harvard for its rejection of President Donald Trump's demands as the university faces a funding freeze for alleged inaction on antisemitism.
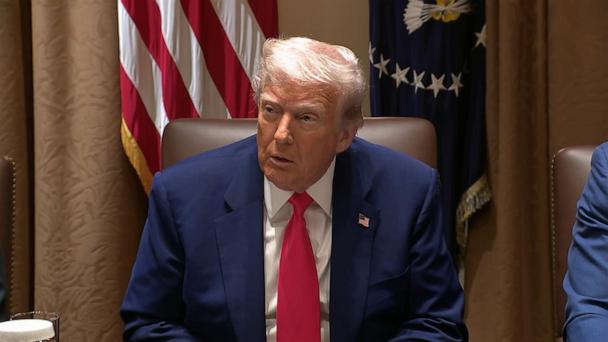
The Trump administration is exempting smartphones, computers, and other electronics from his reciprocal tariffs, according to a bulletin posted by U.S. Customs and Border Protection late Friday night.