Political News

Latest Videos
1:56
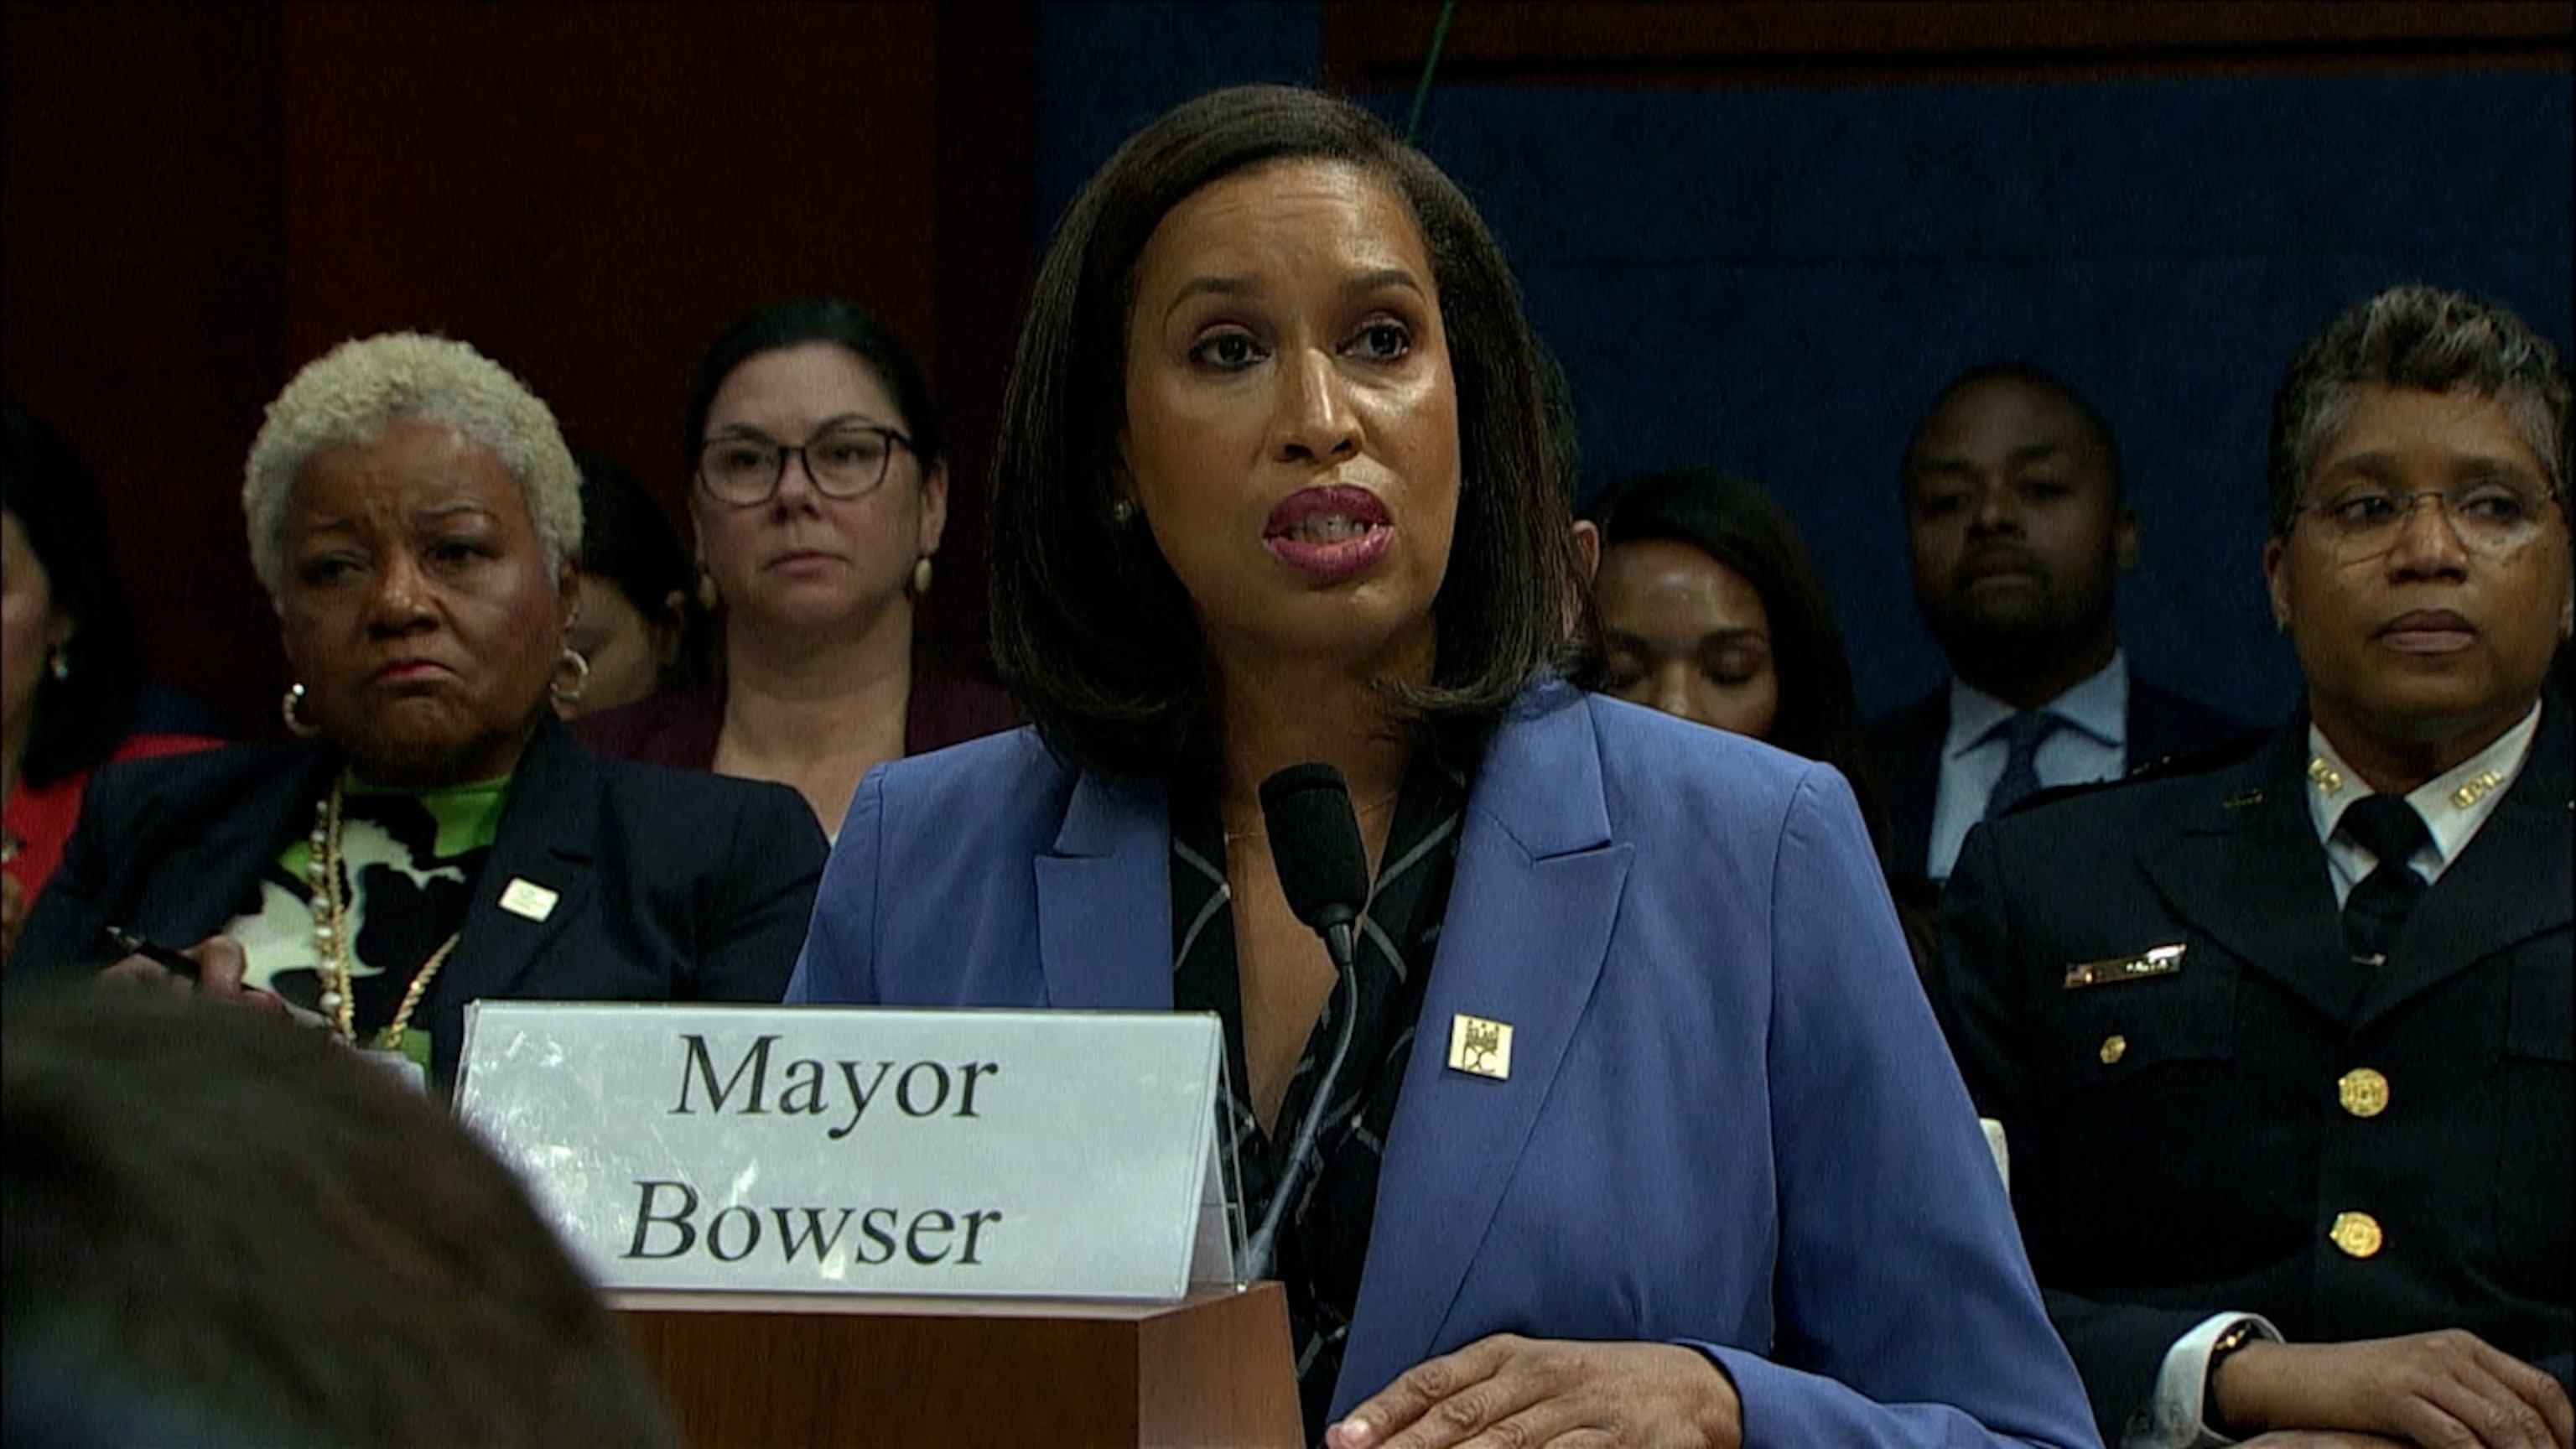
DC leaders debate crime in contentious House hearing
- 3 hours ago
0:33
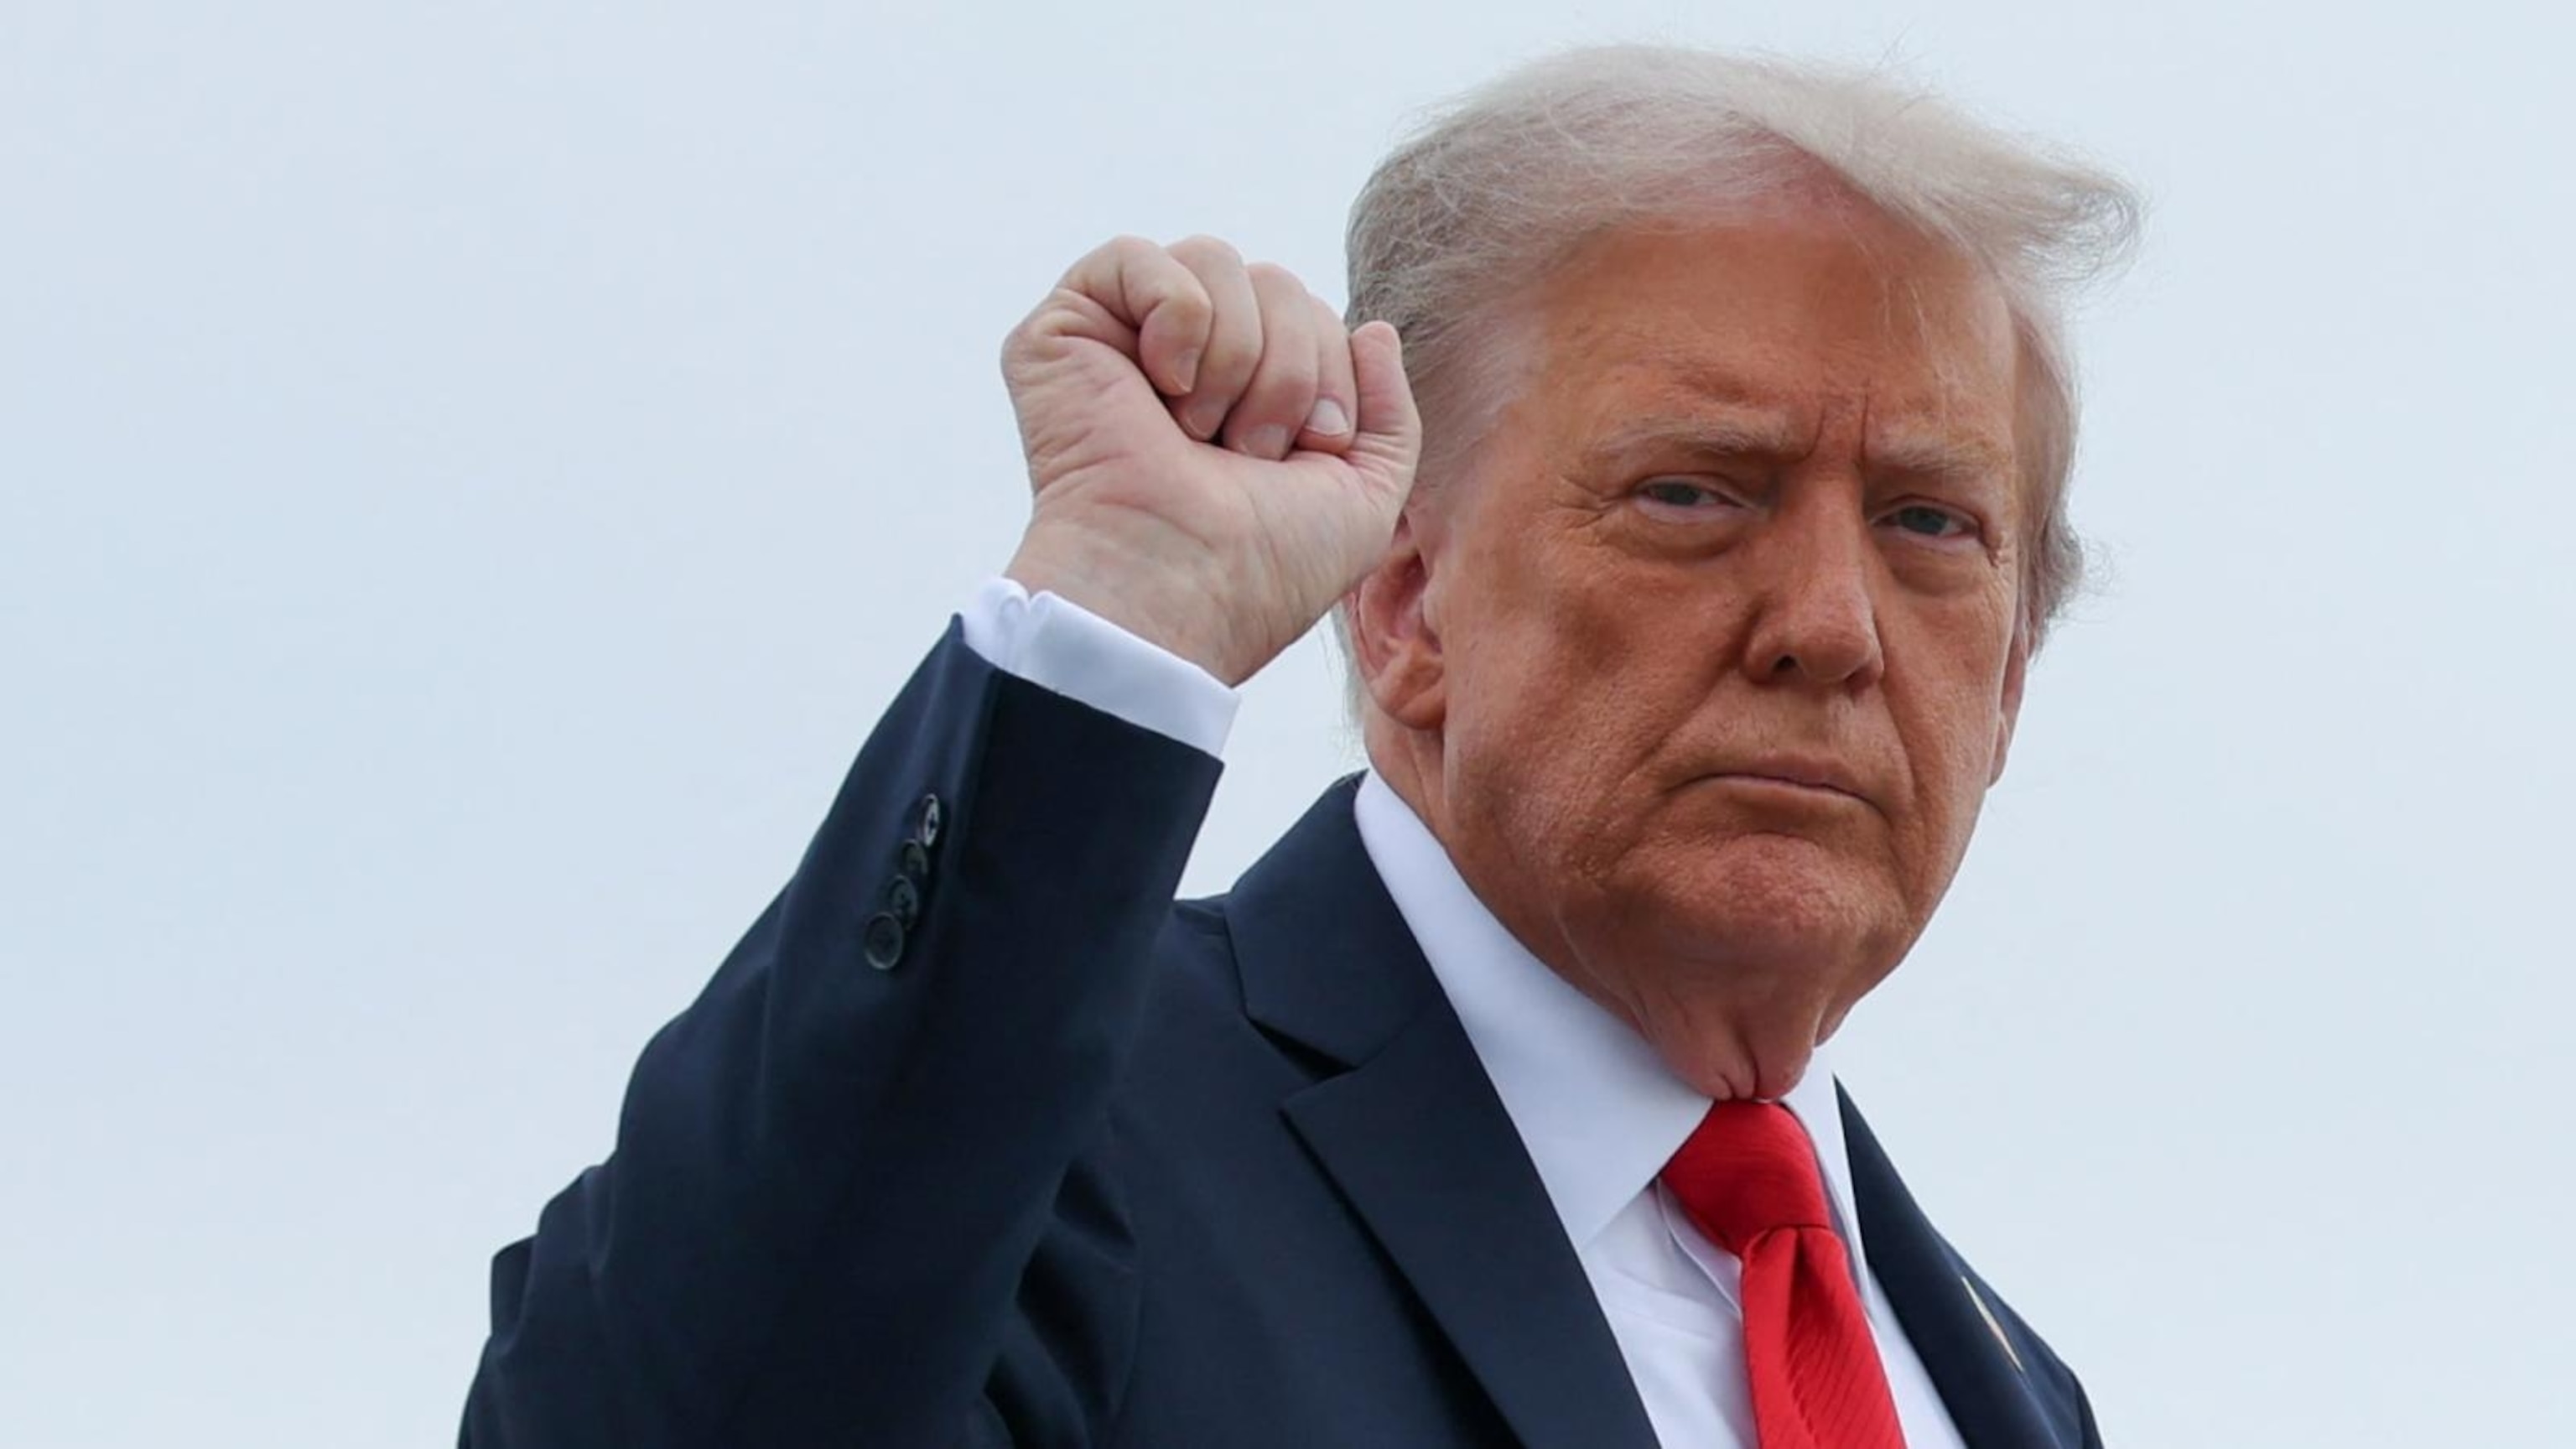
Trump asks SCOTUS to let him remove Lisa Cook from Fed Reserve
- 7 hours ago
2:53
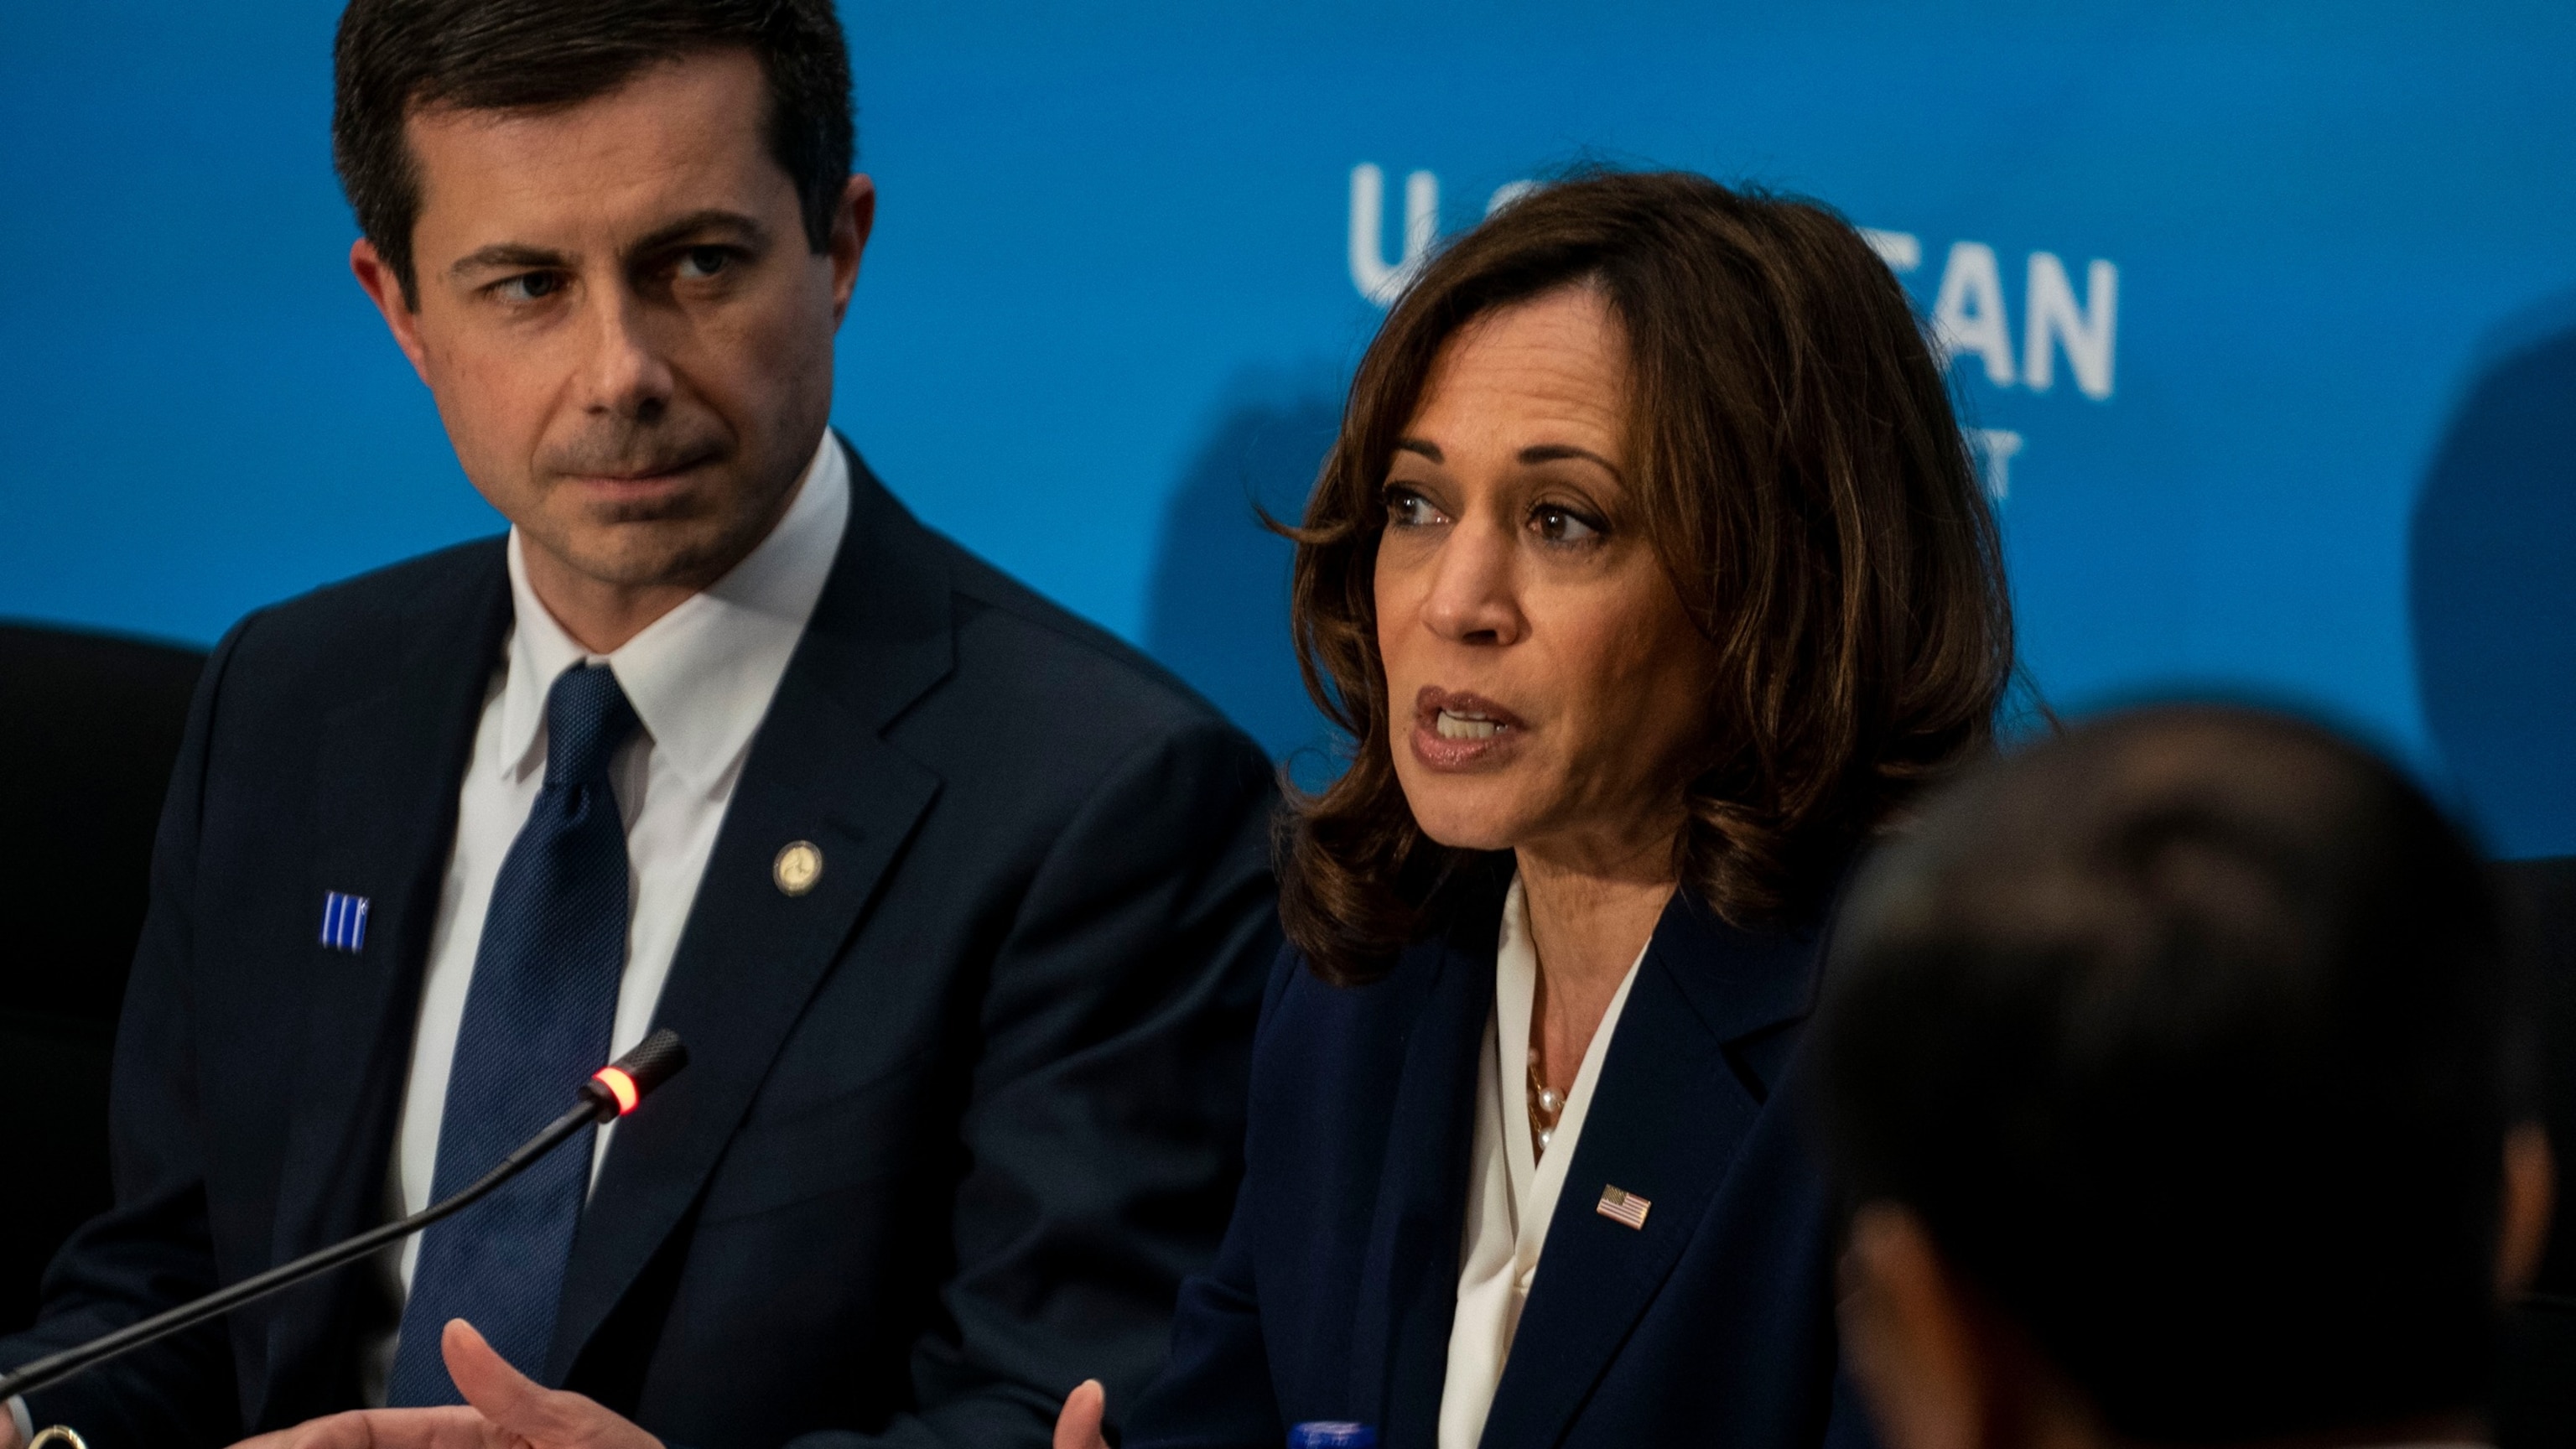
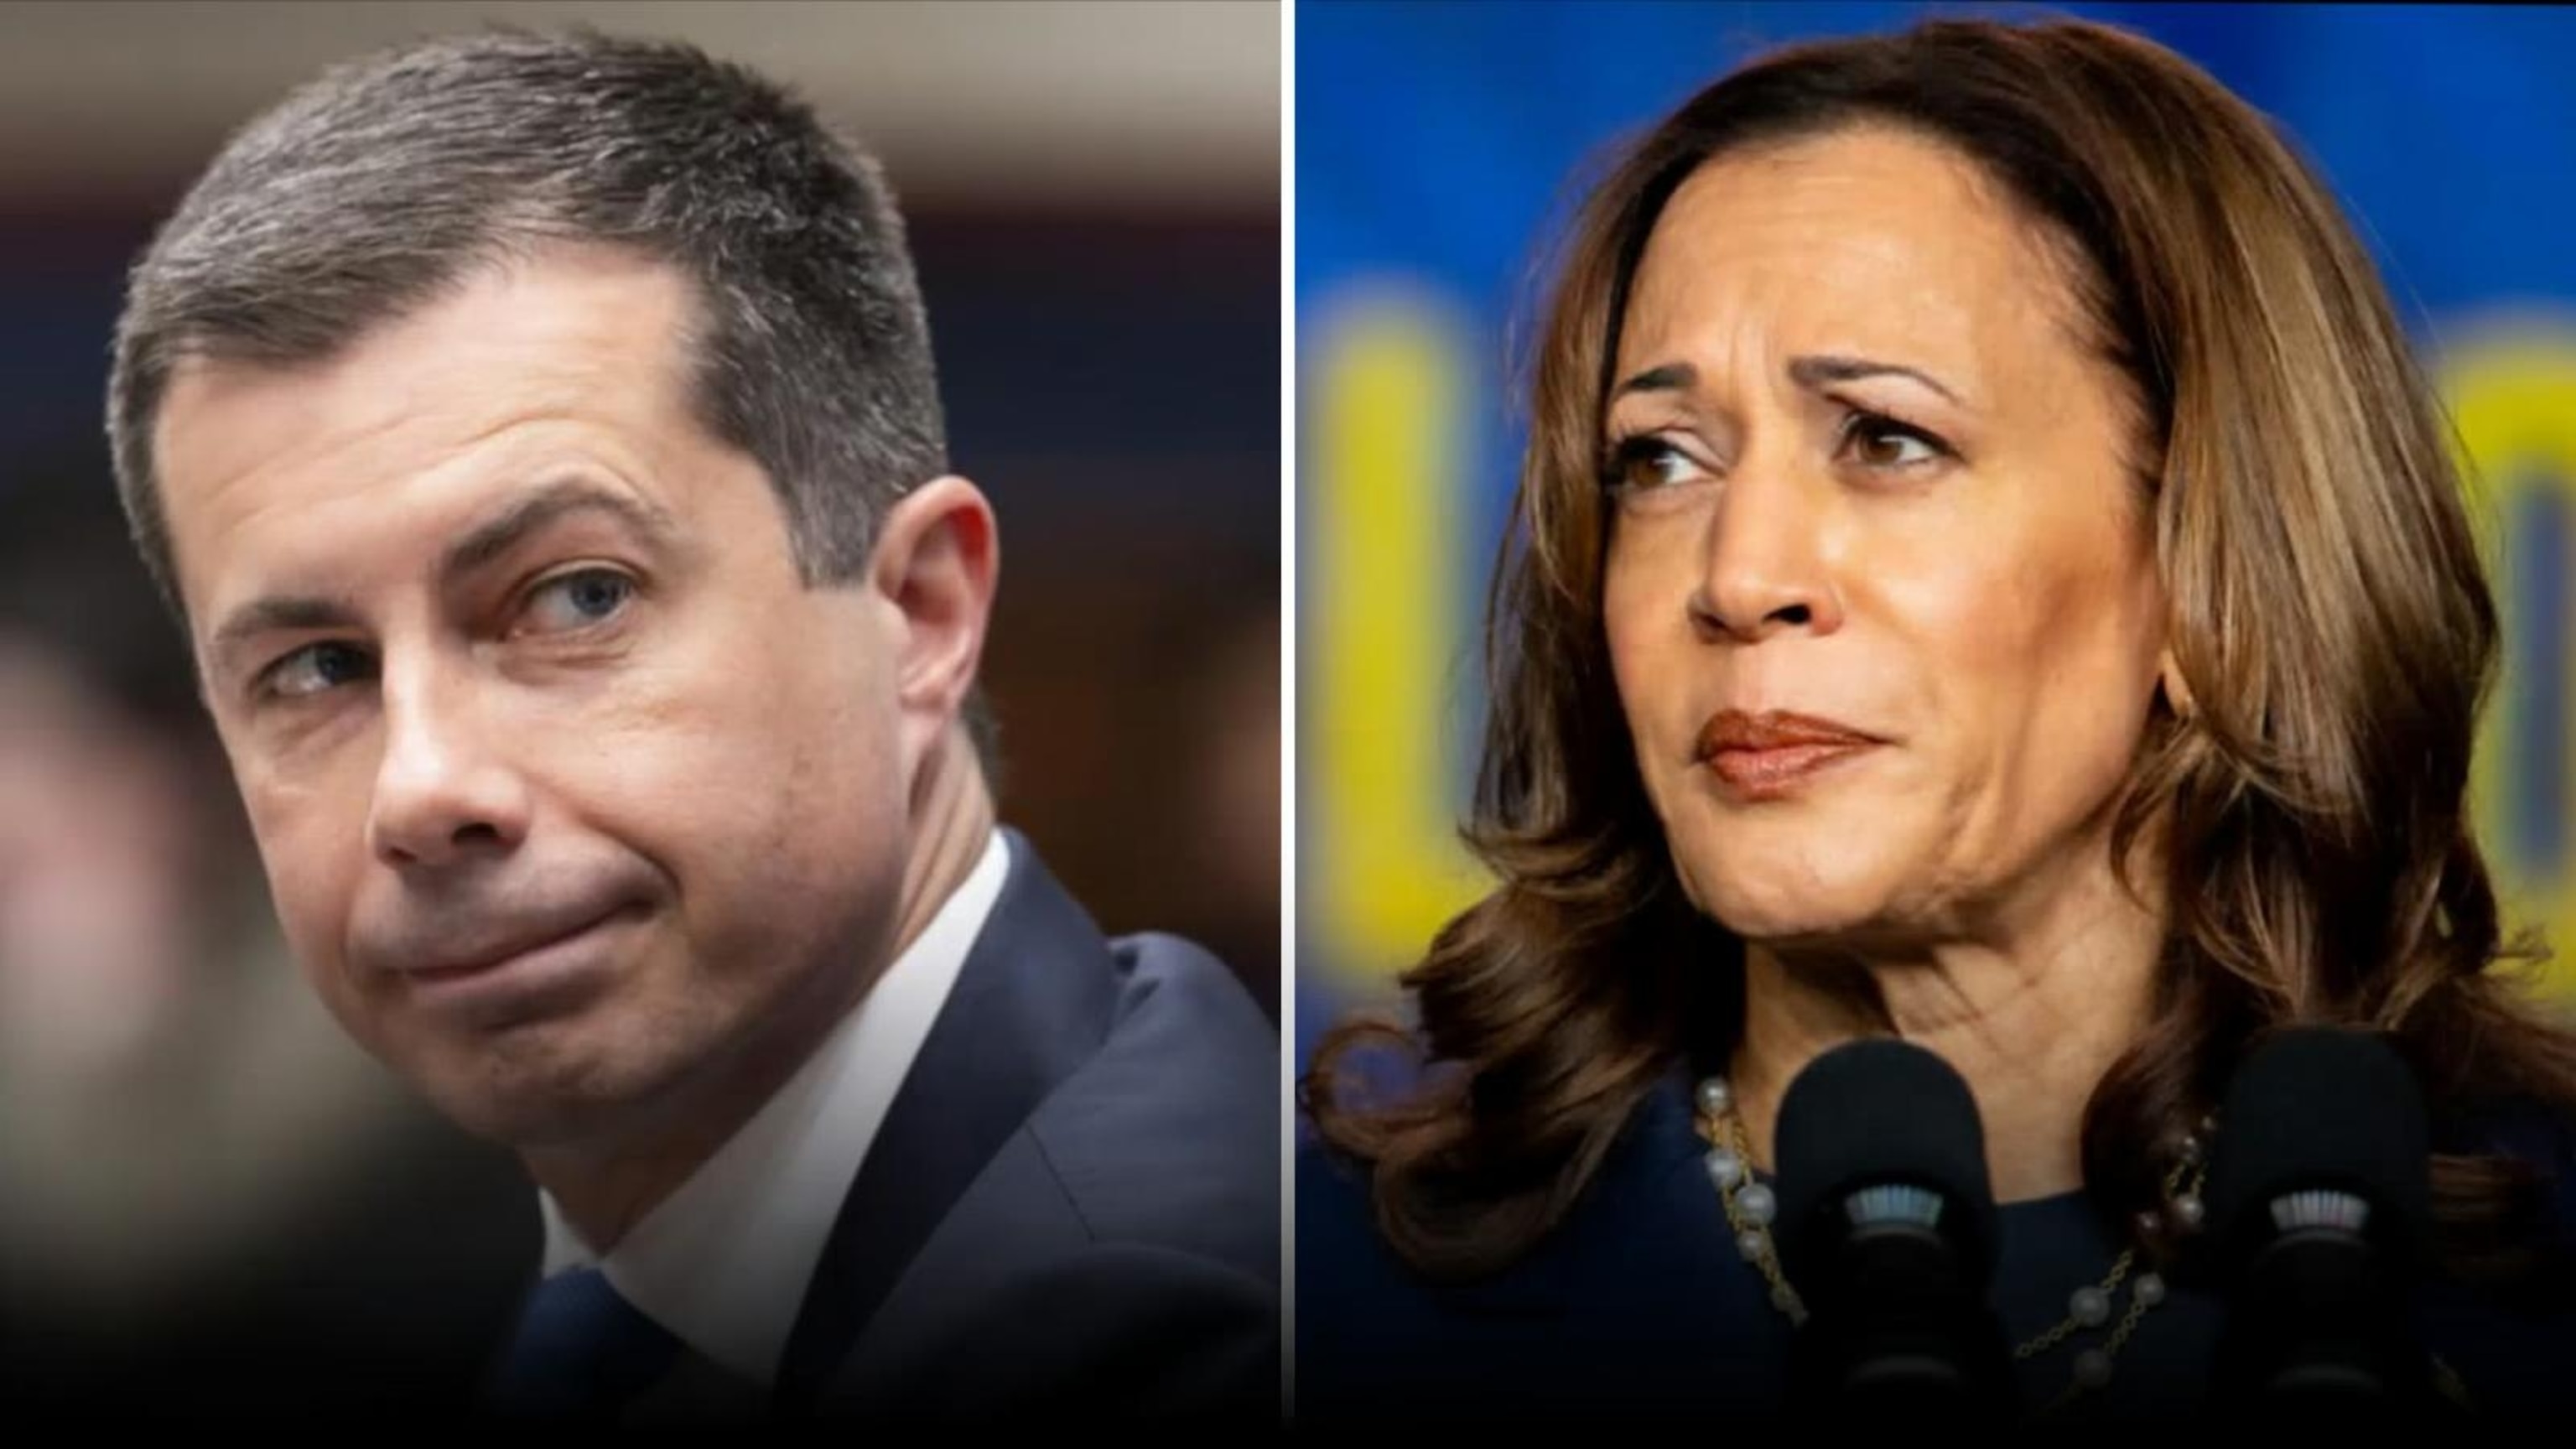
Kamala Harris wrote Buttigieg was top choice for running mate: The Atlantic
- 7 hours ago
5:02
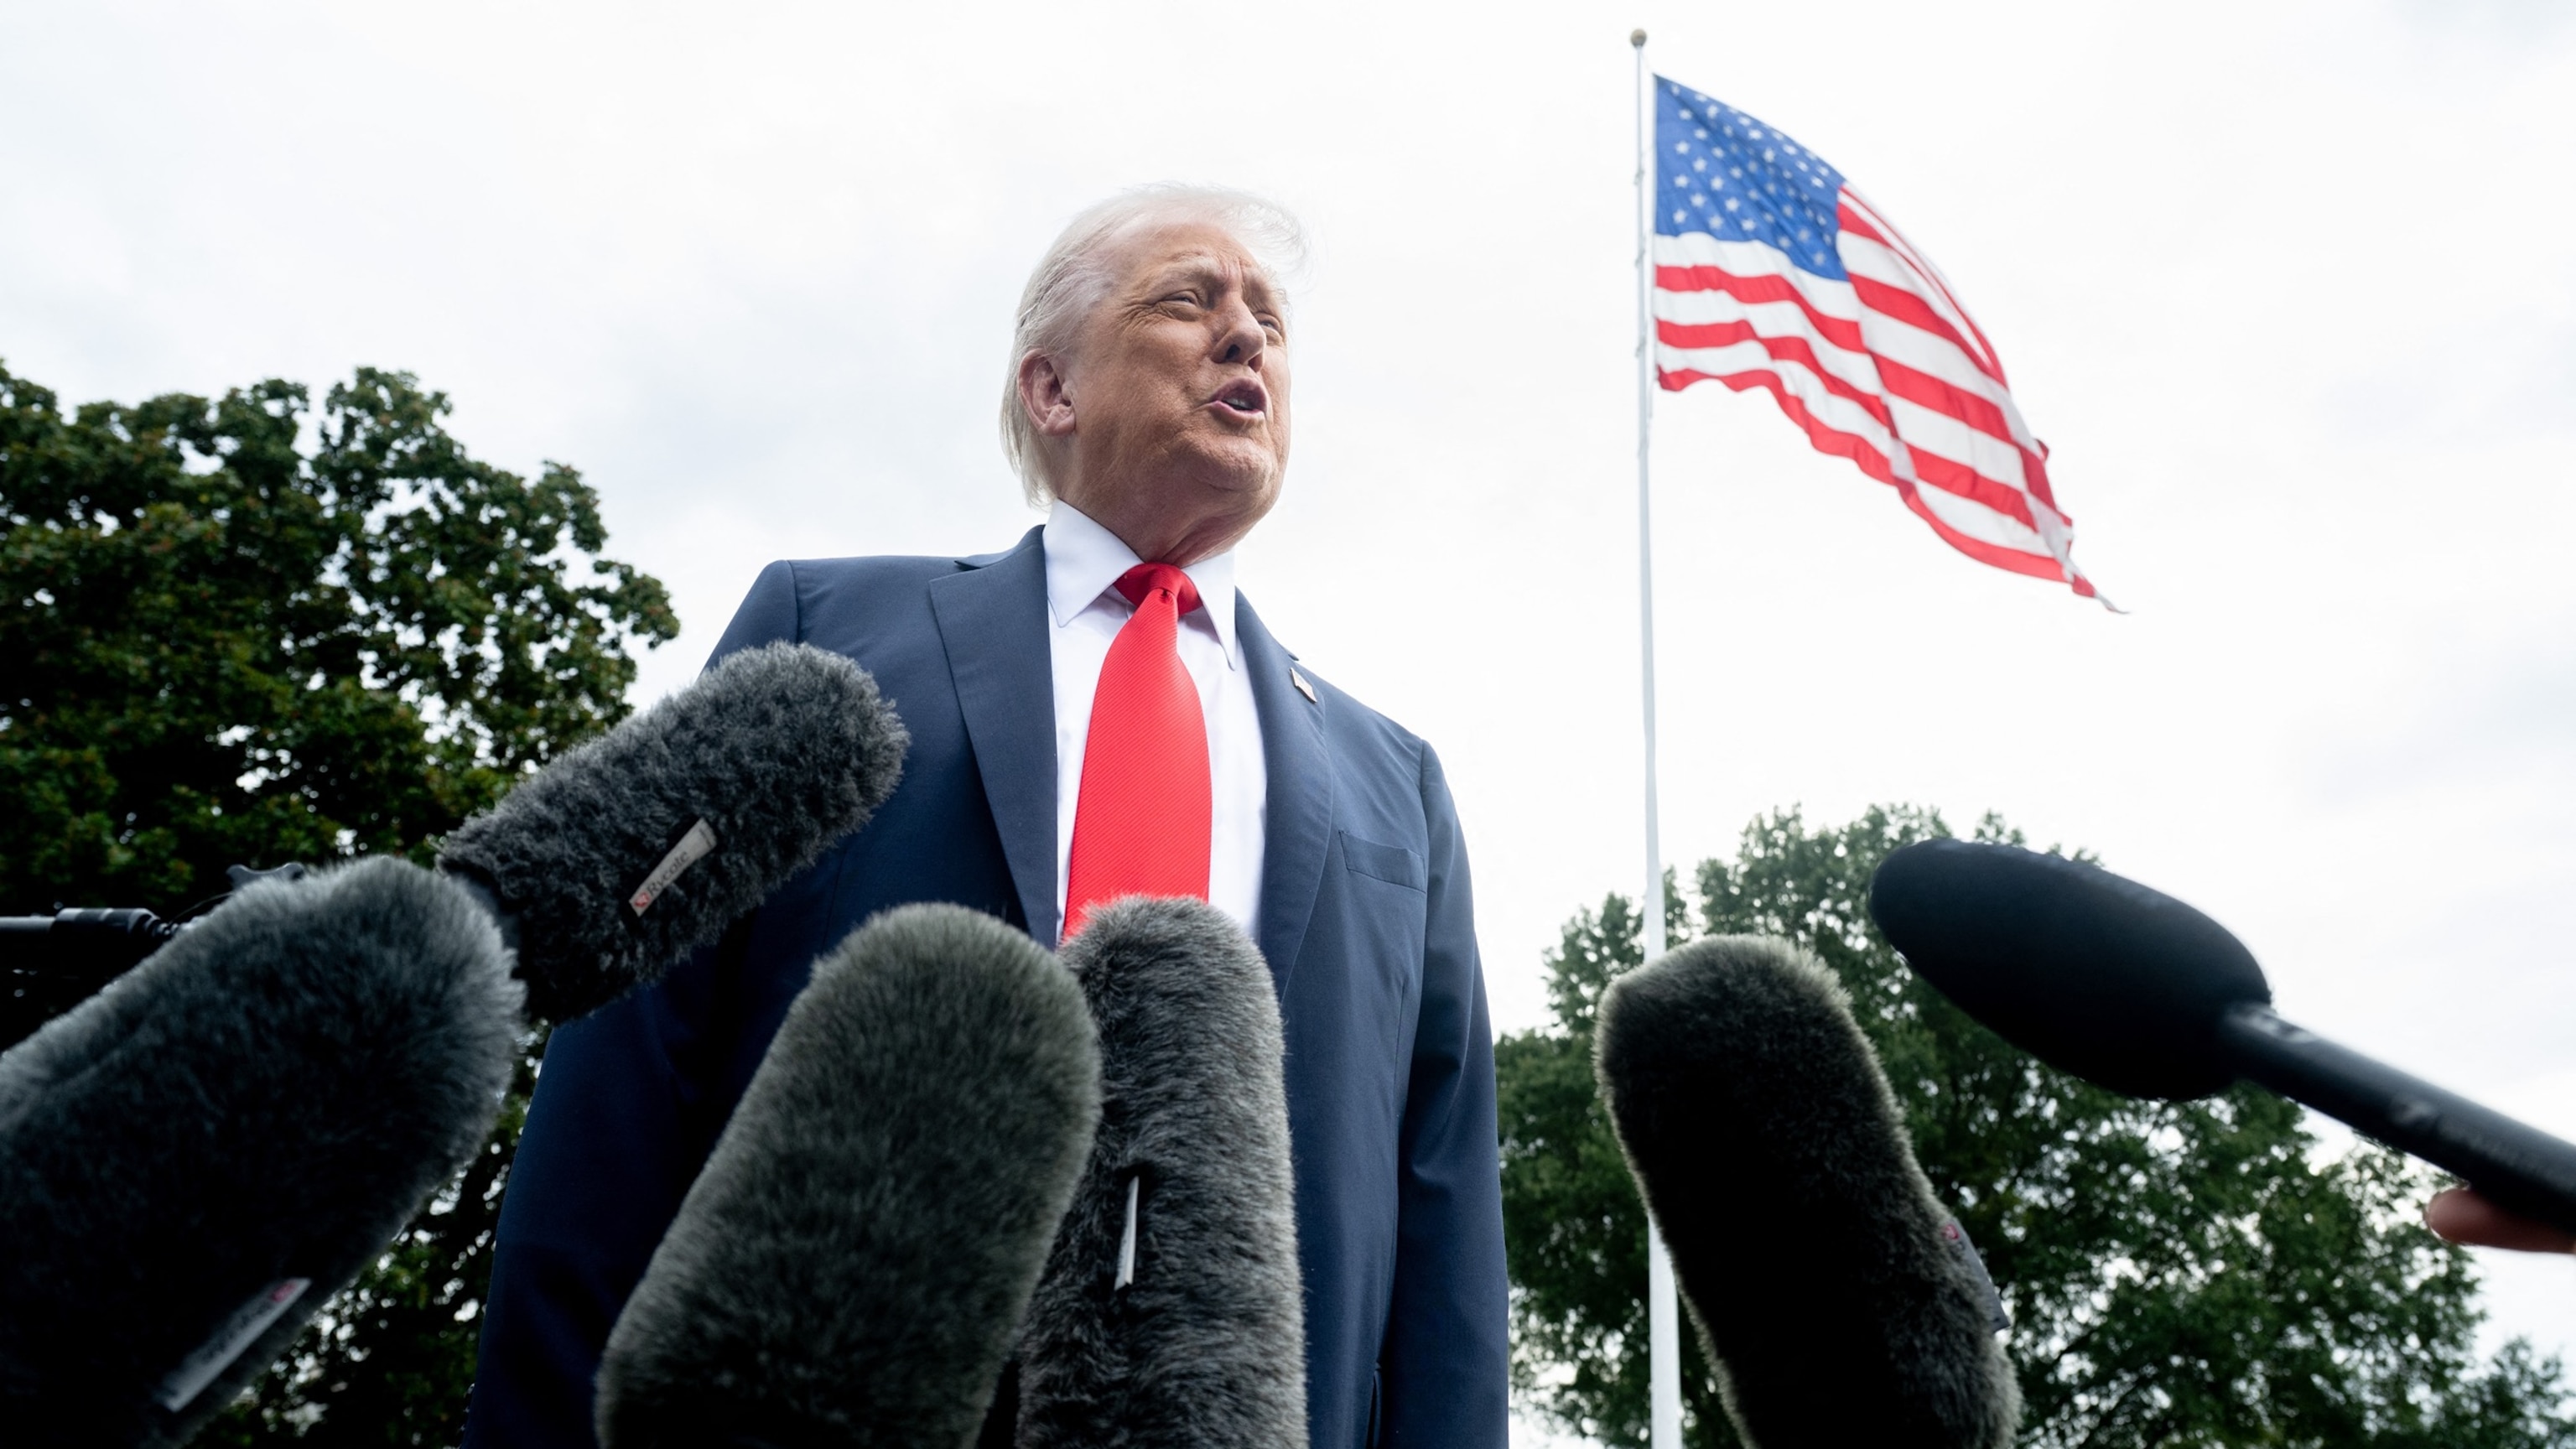
Trump says he'll seek to designate antifa as 'major terrorist organization'
- 7 hours ago
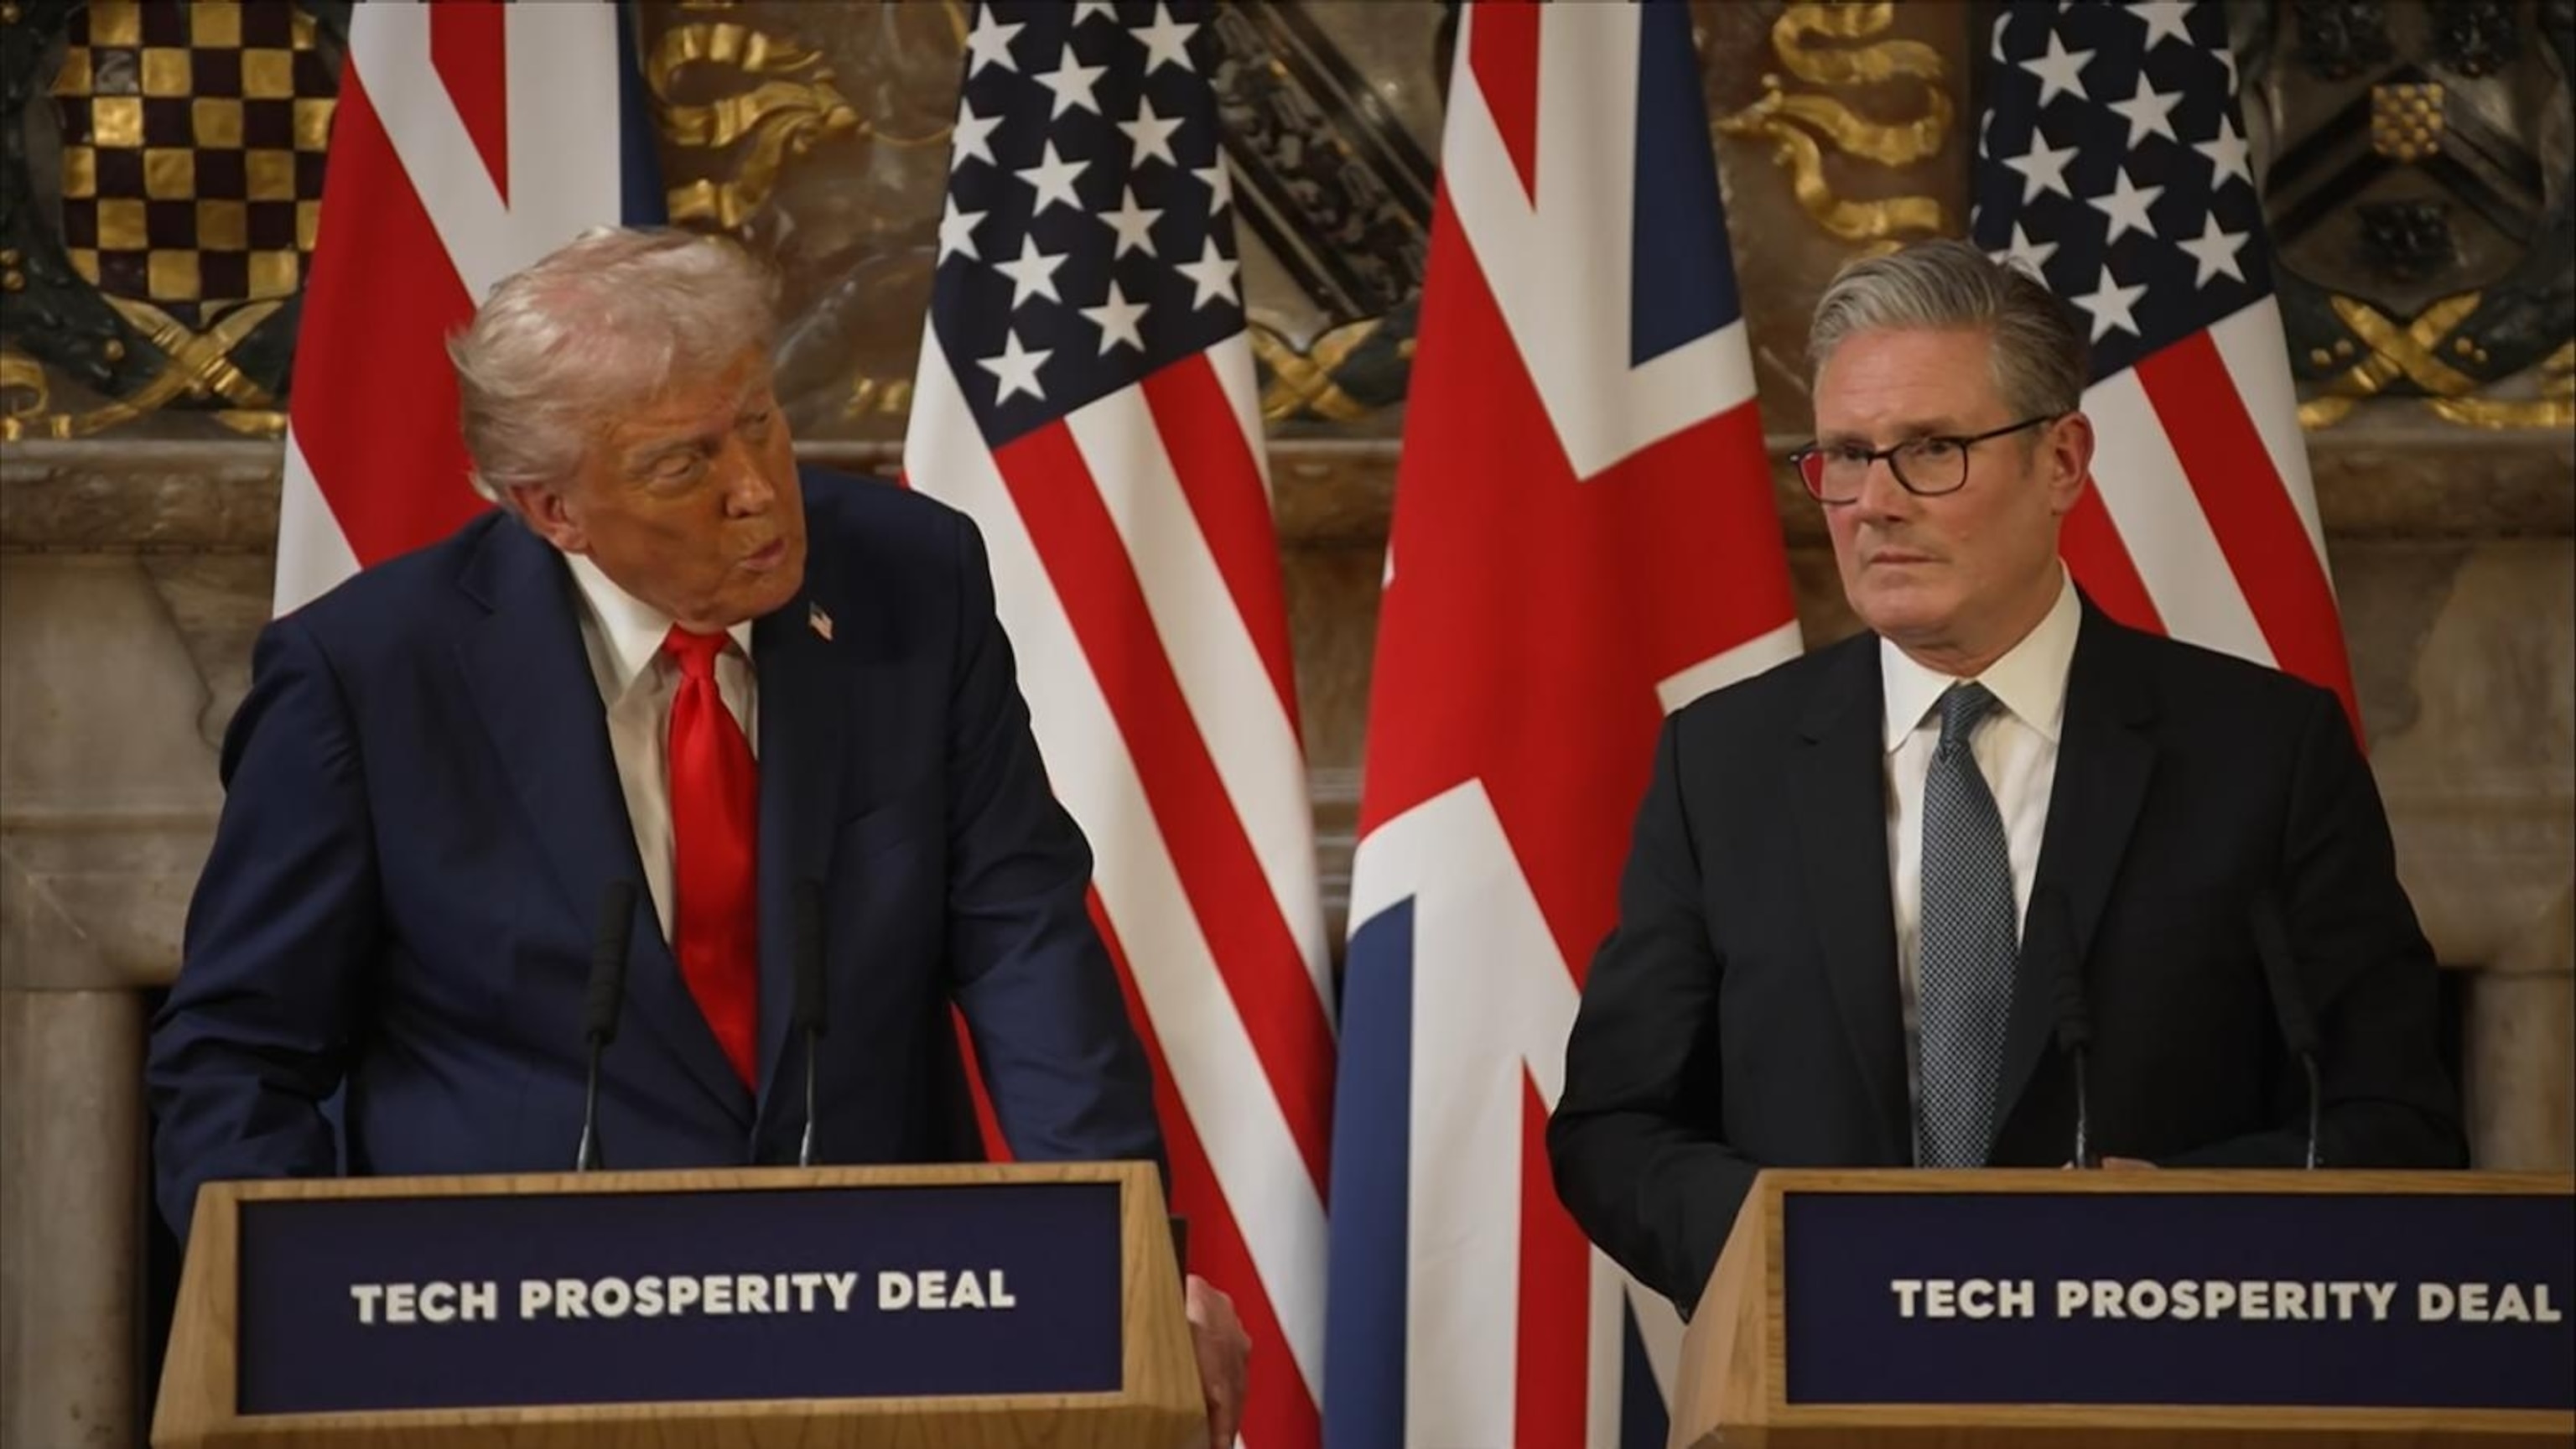
9:35
Trump, Starmer hold news conference after signing science, tech partnership
- 8 hours ago
1:06
Charlie Kirk had 'good shot' of being president one day, Trump says
- 9 hours ago
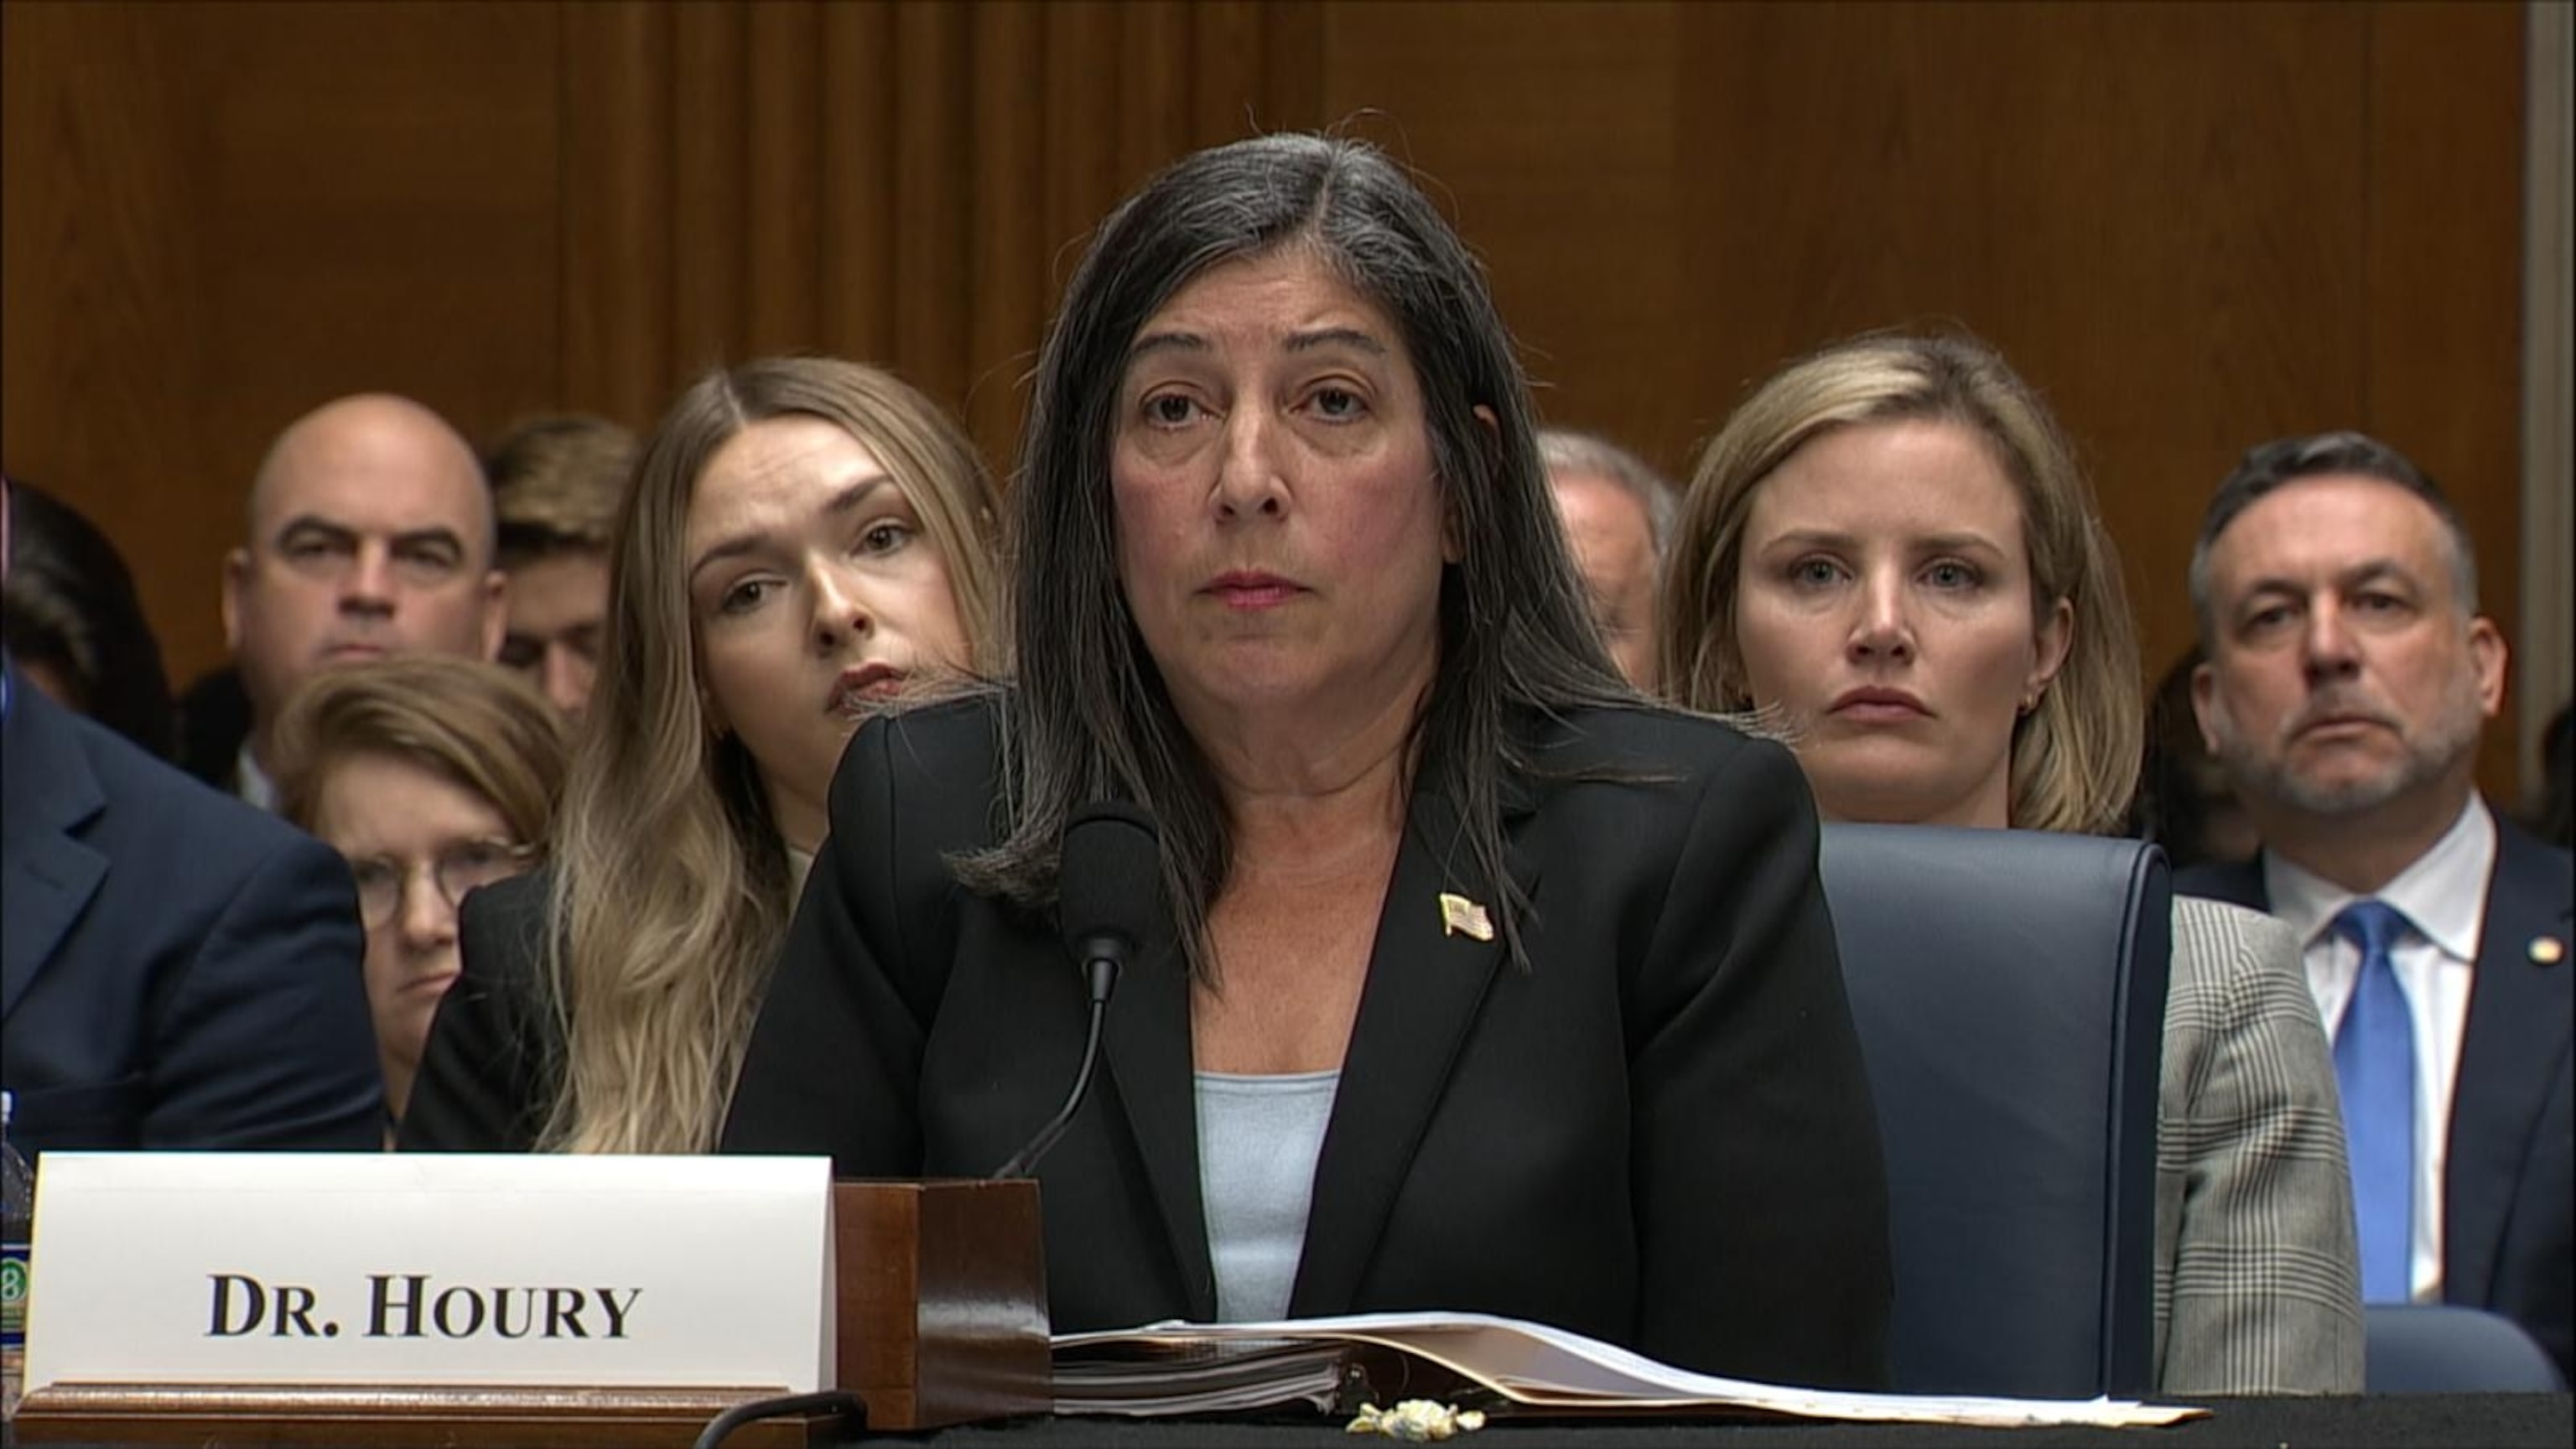
3:34
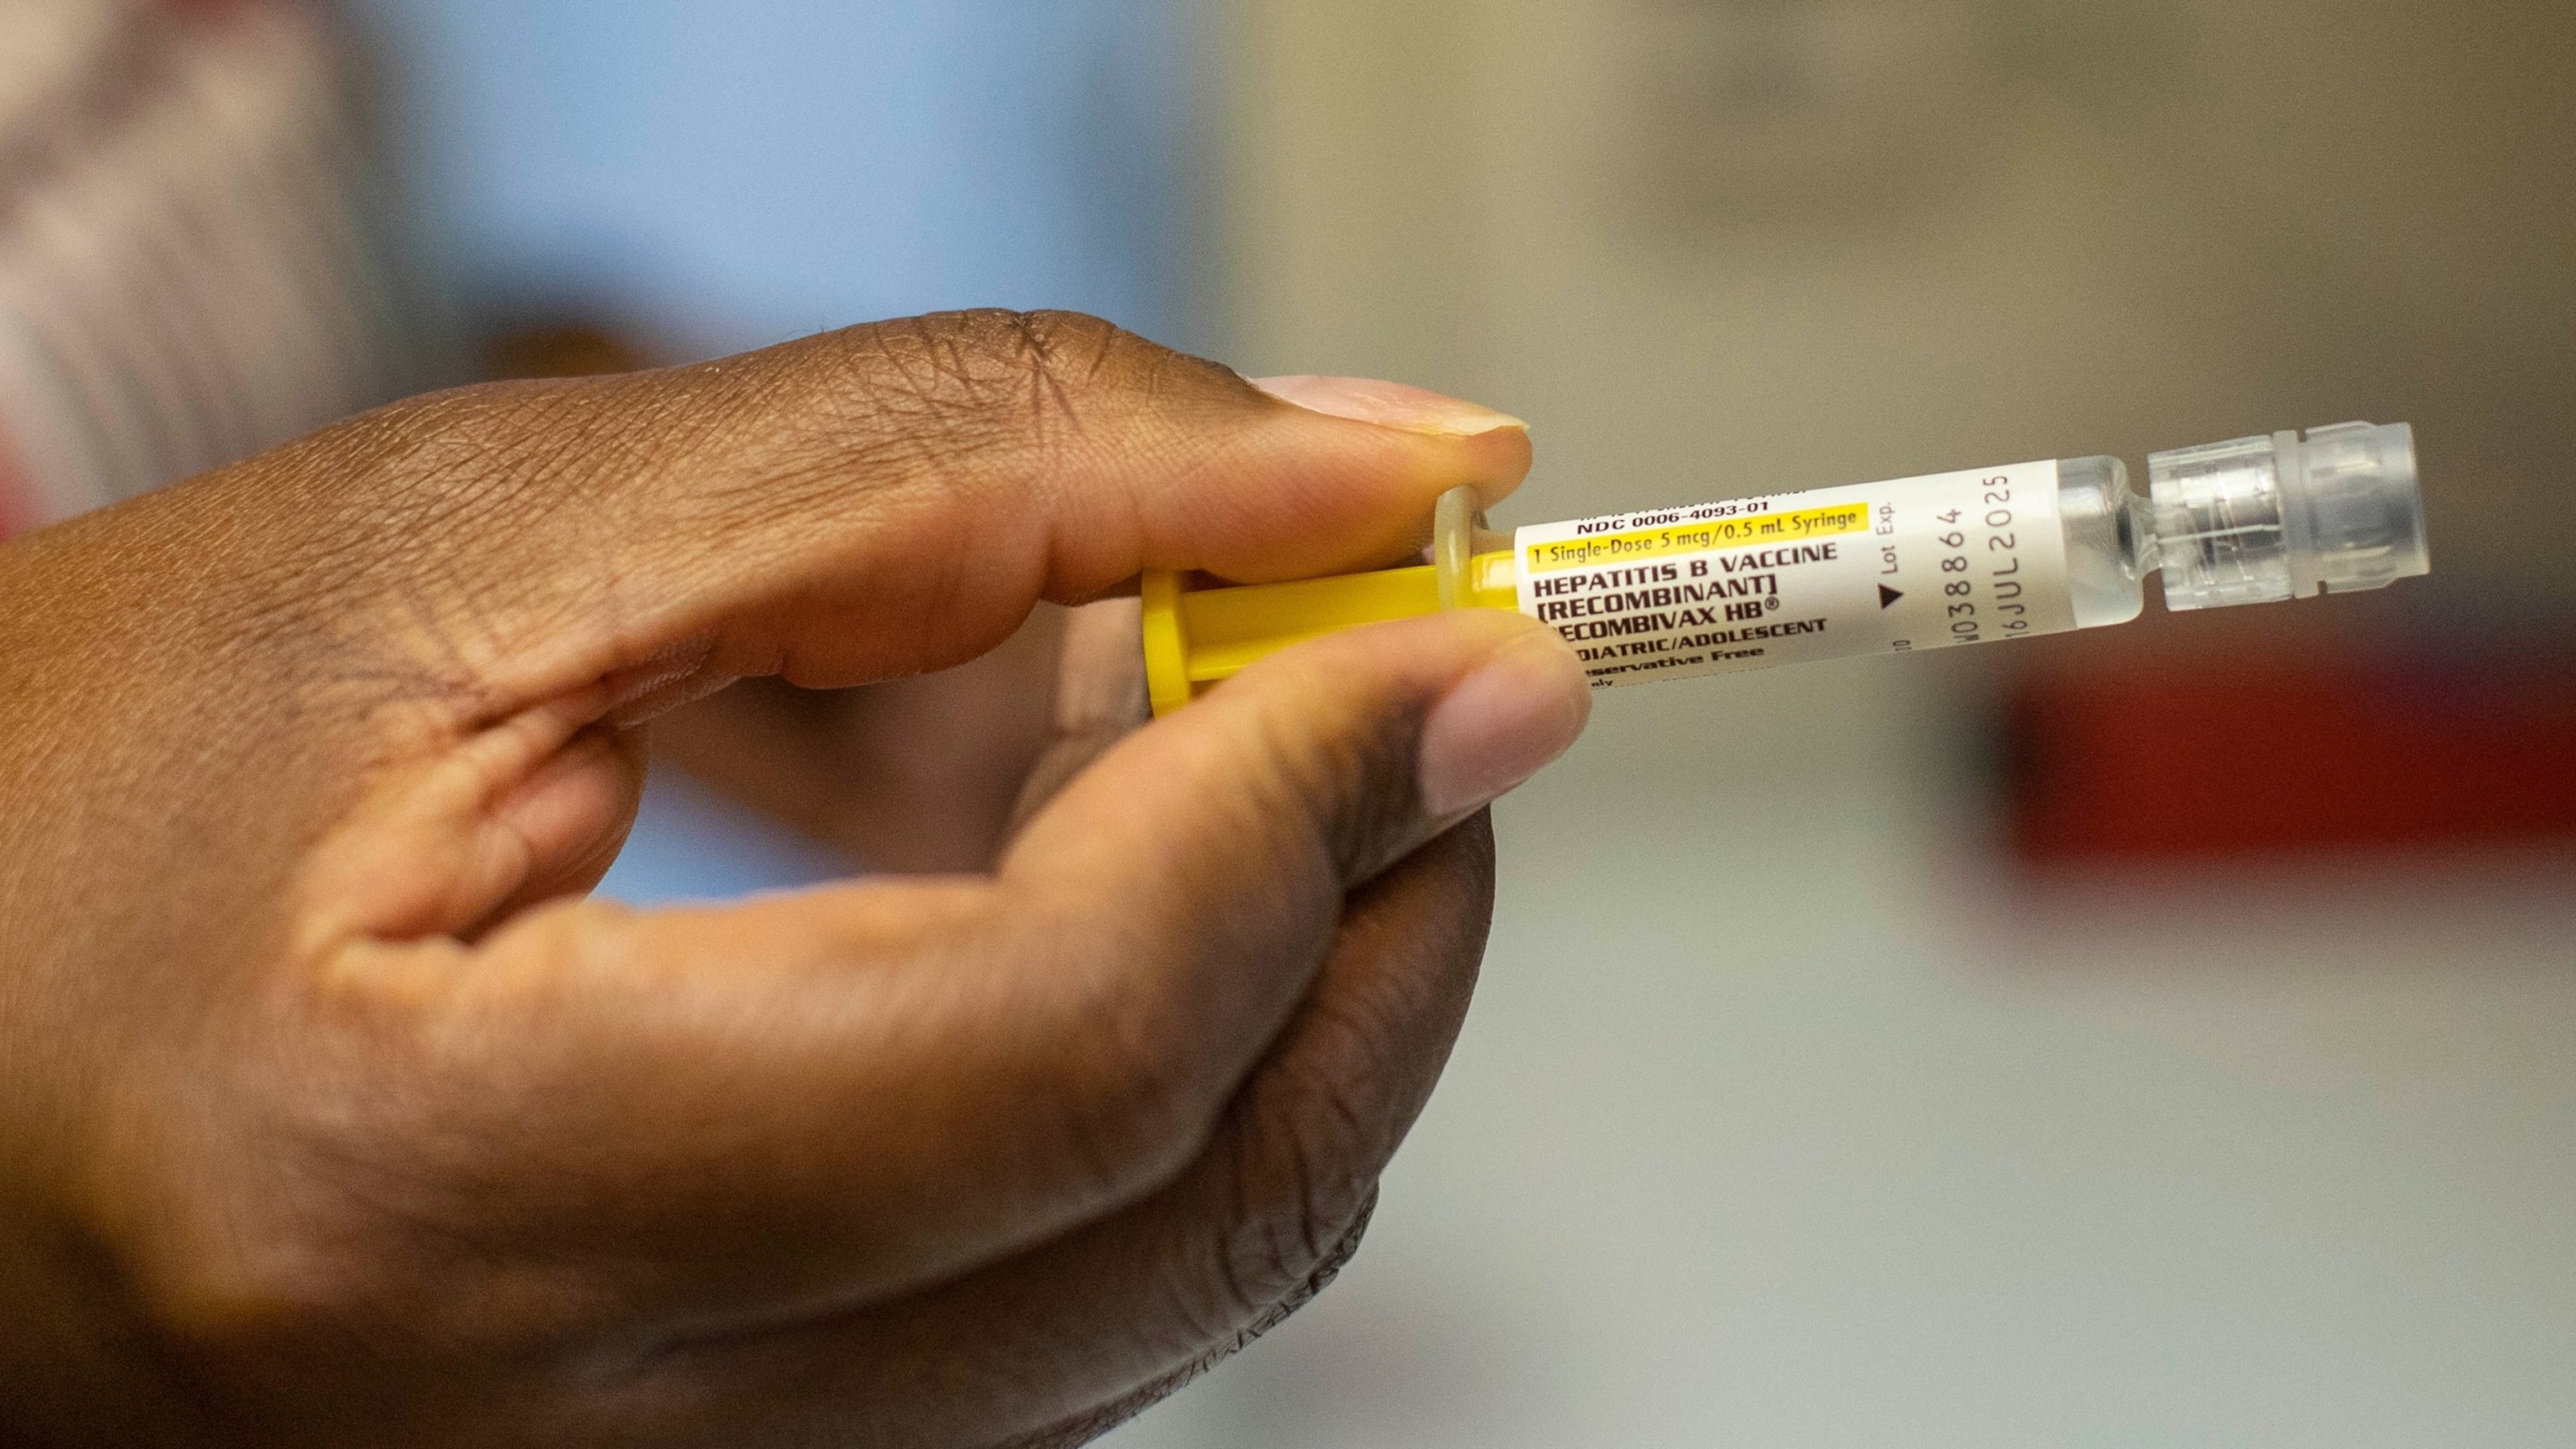
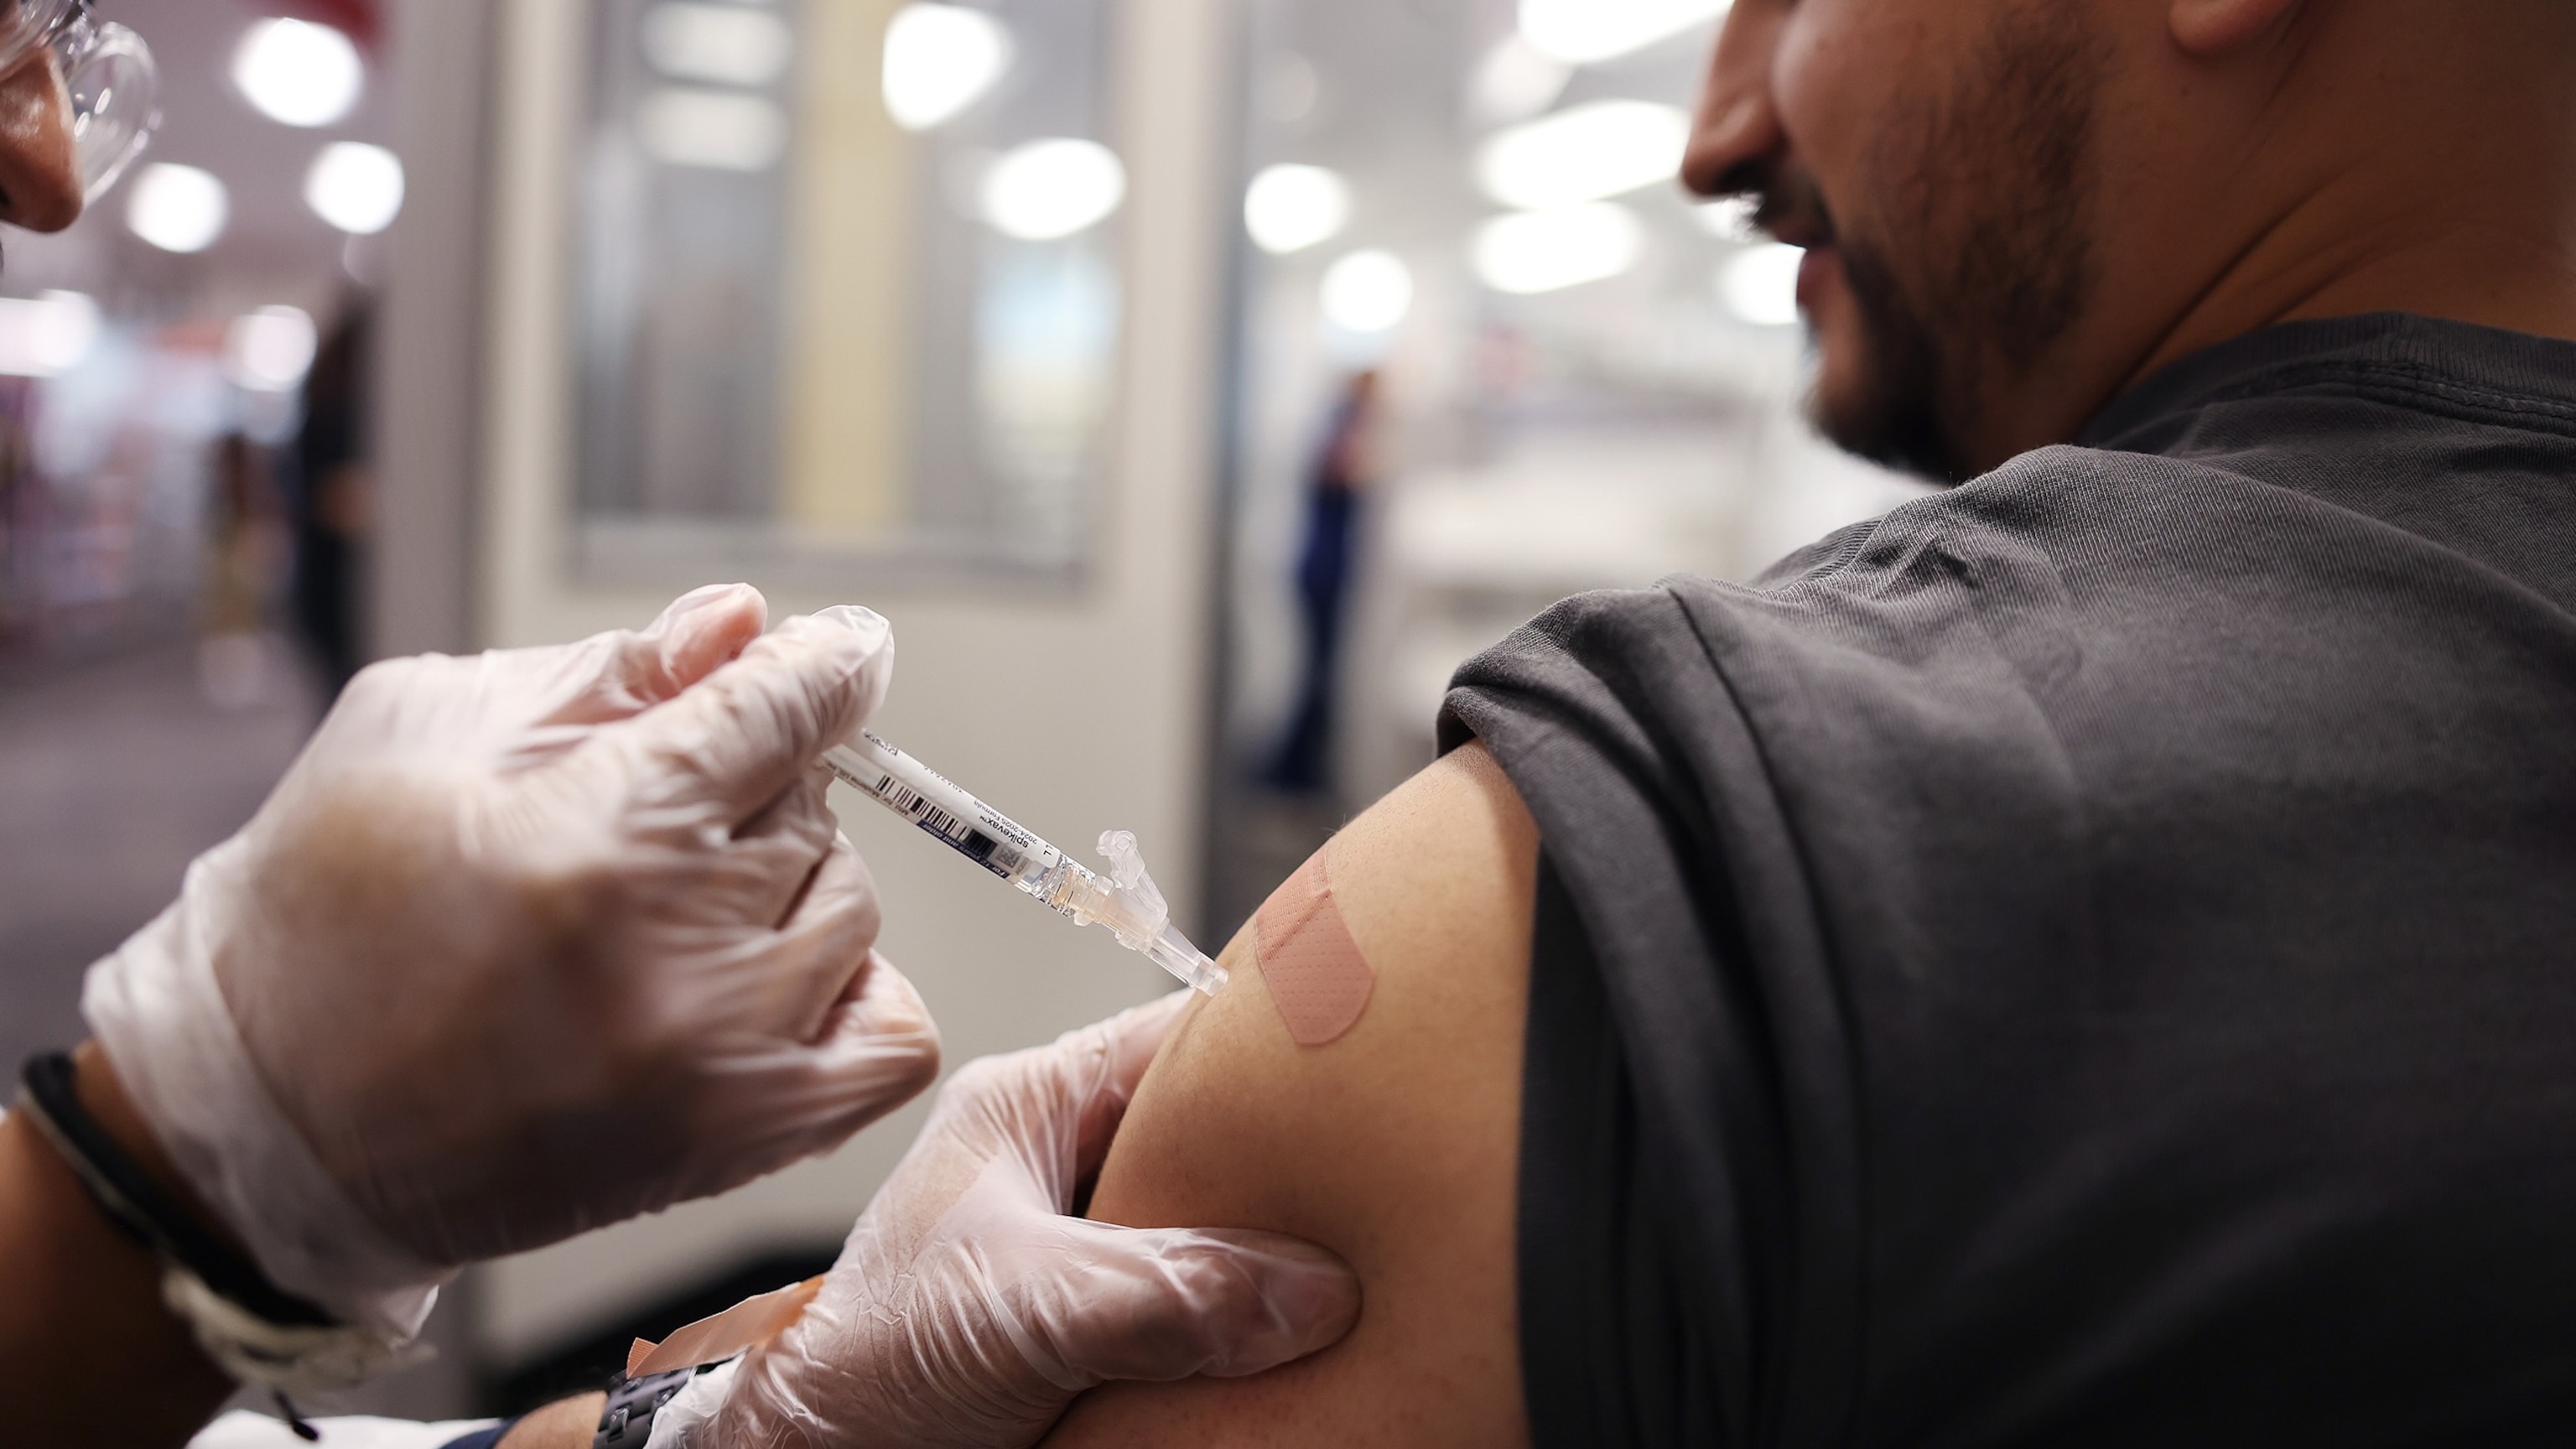
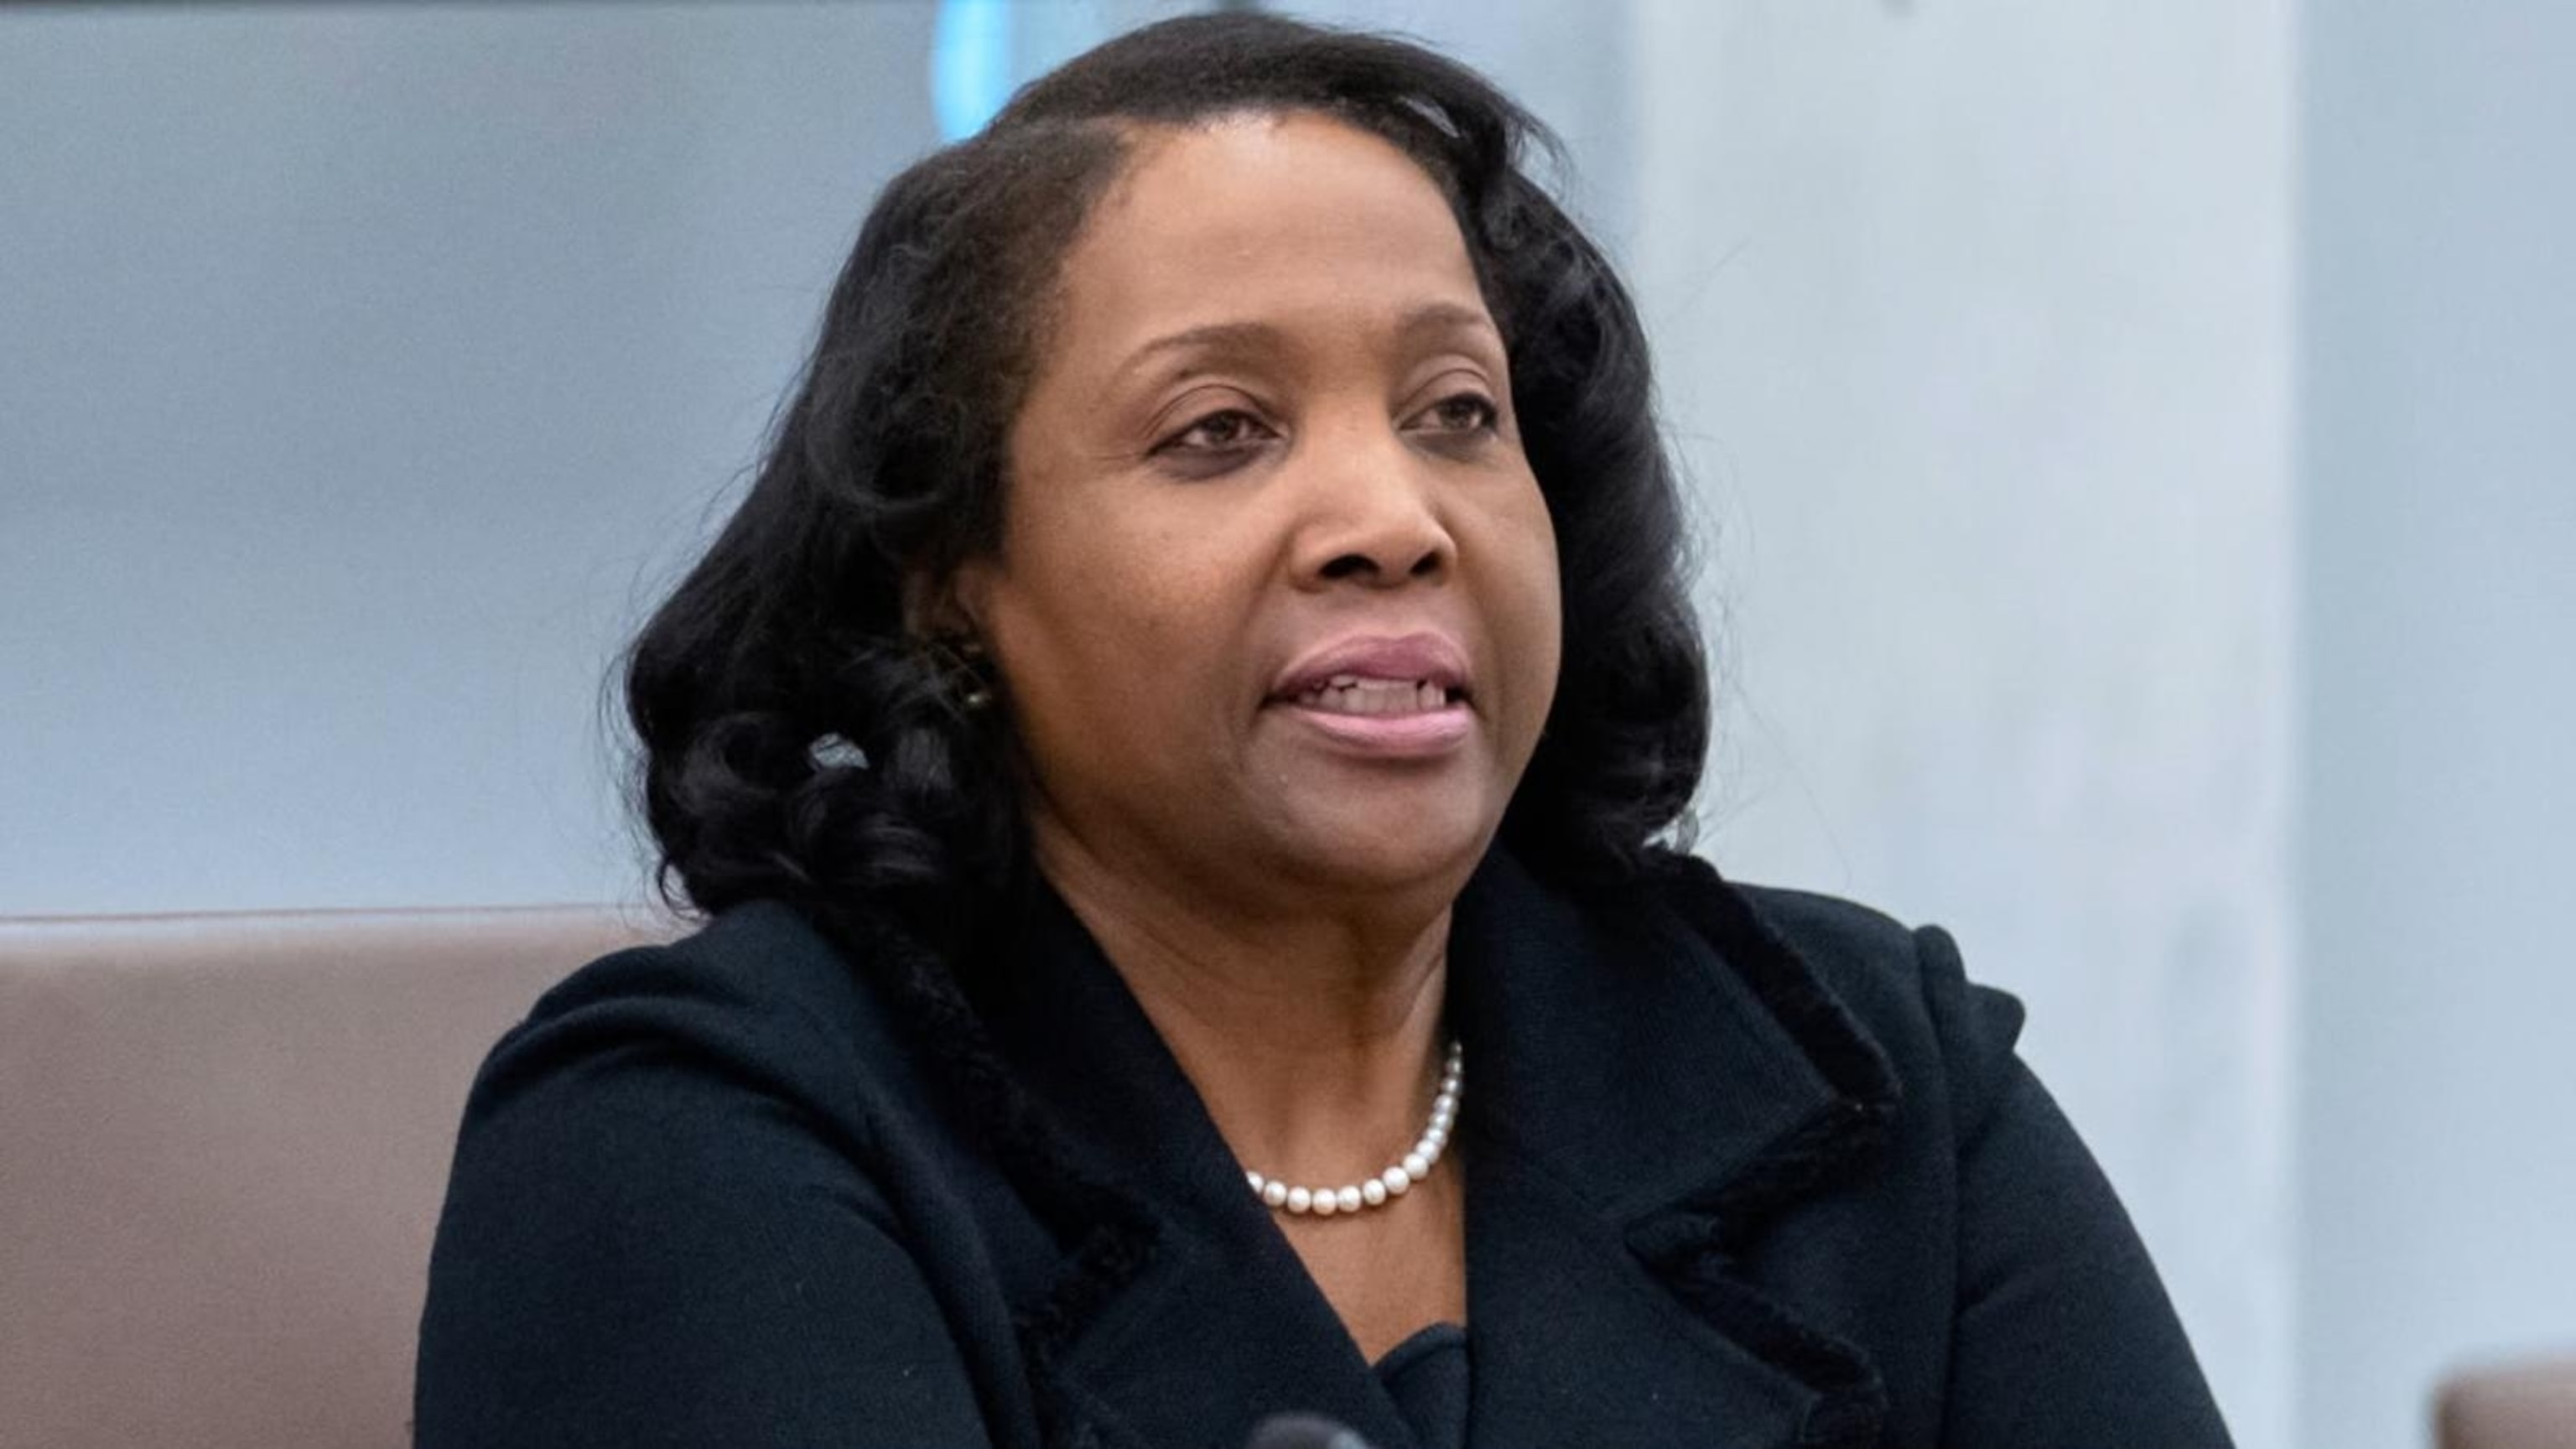
RFK Jr. said 'changes' coming to childhood vaccine schedule, according to Monarez
- 1 day ago
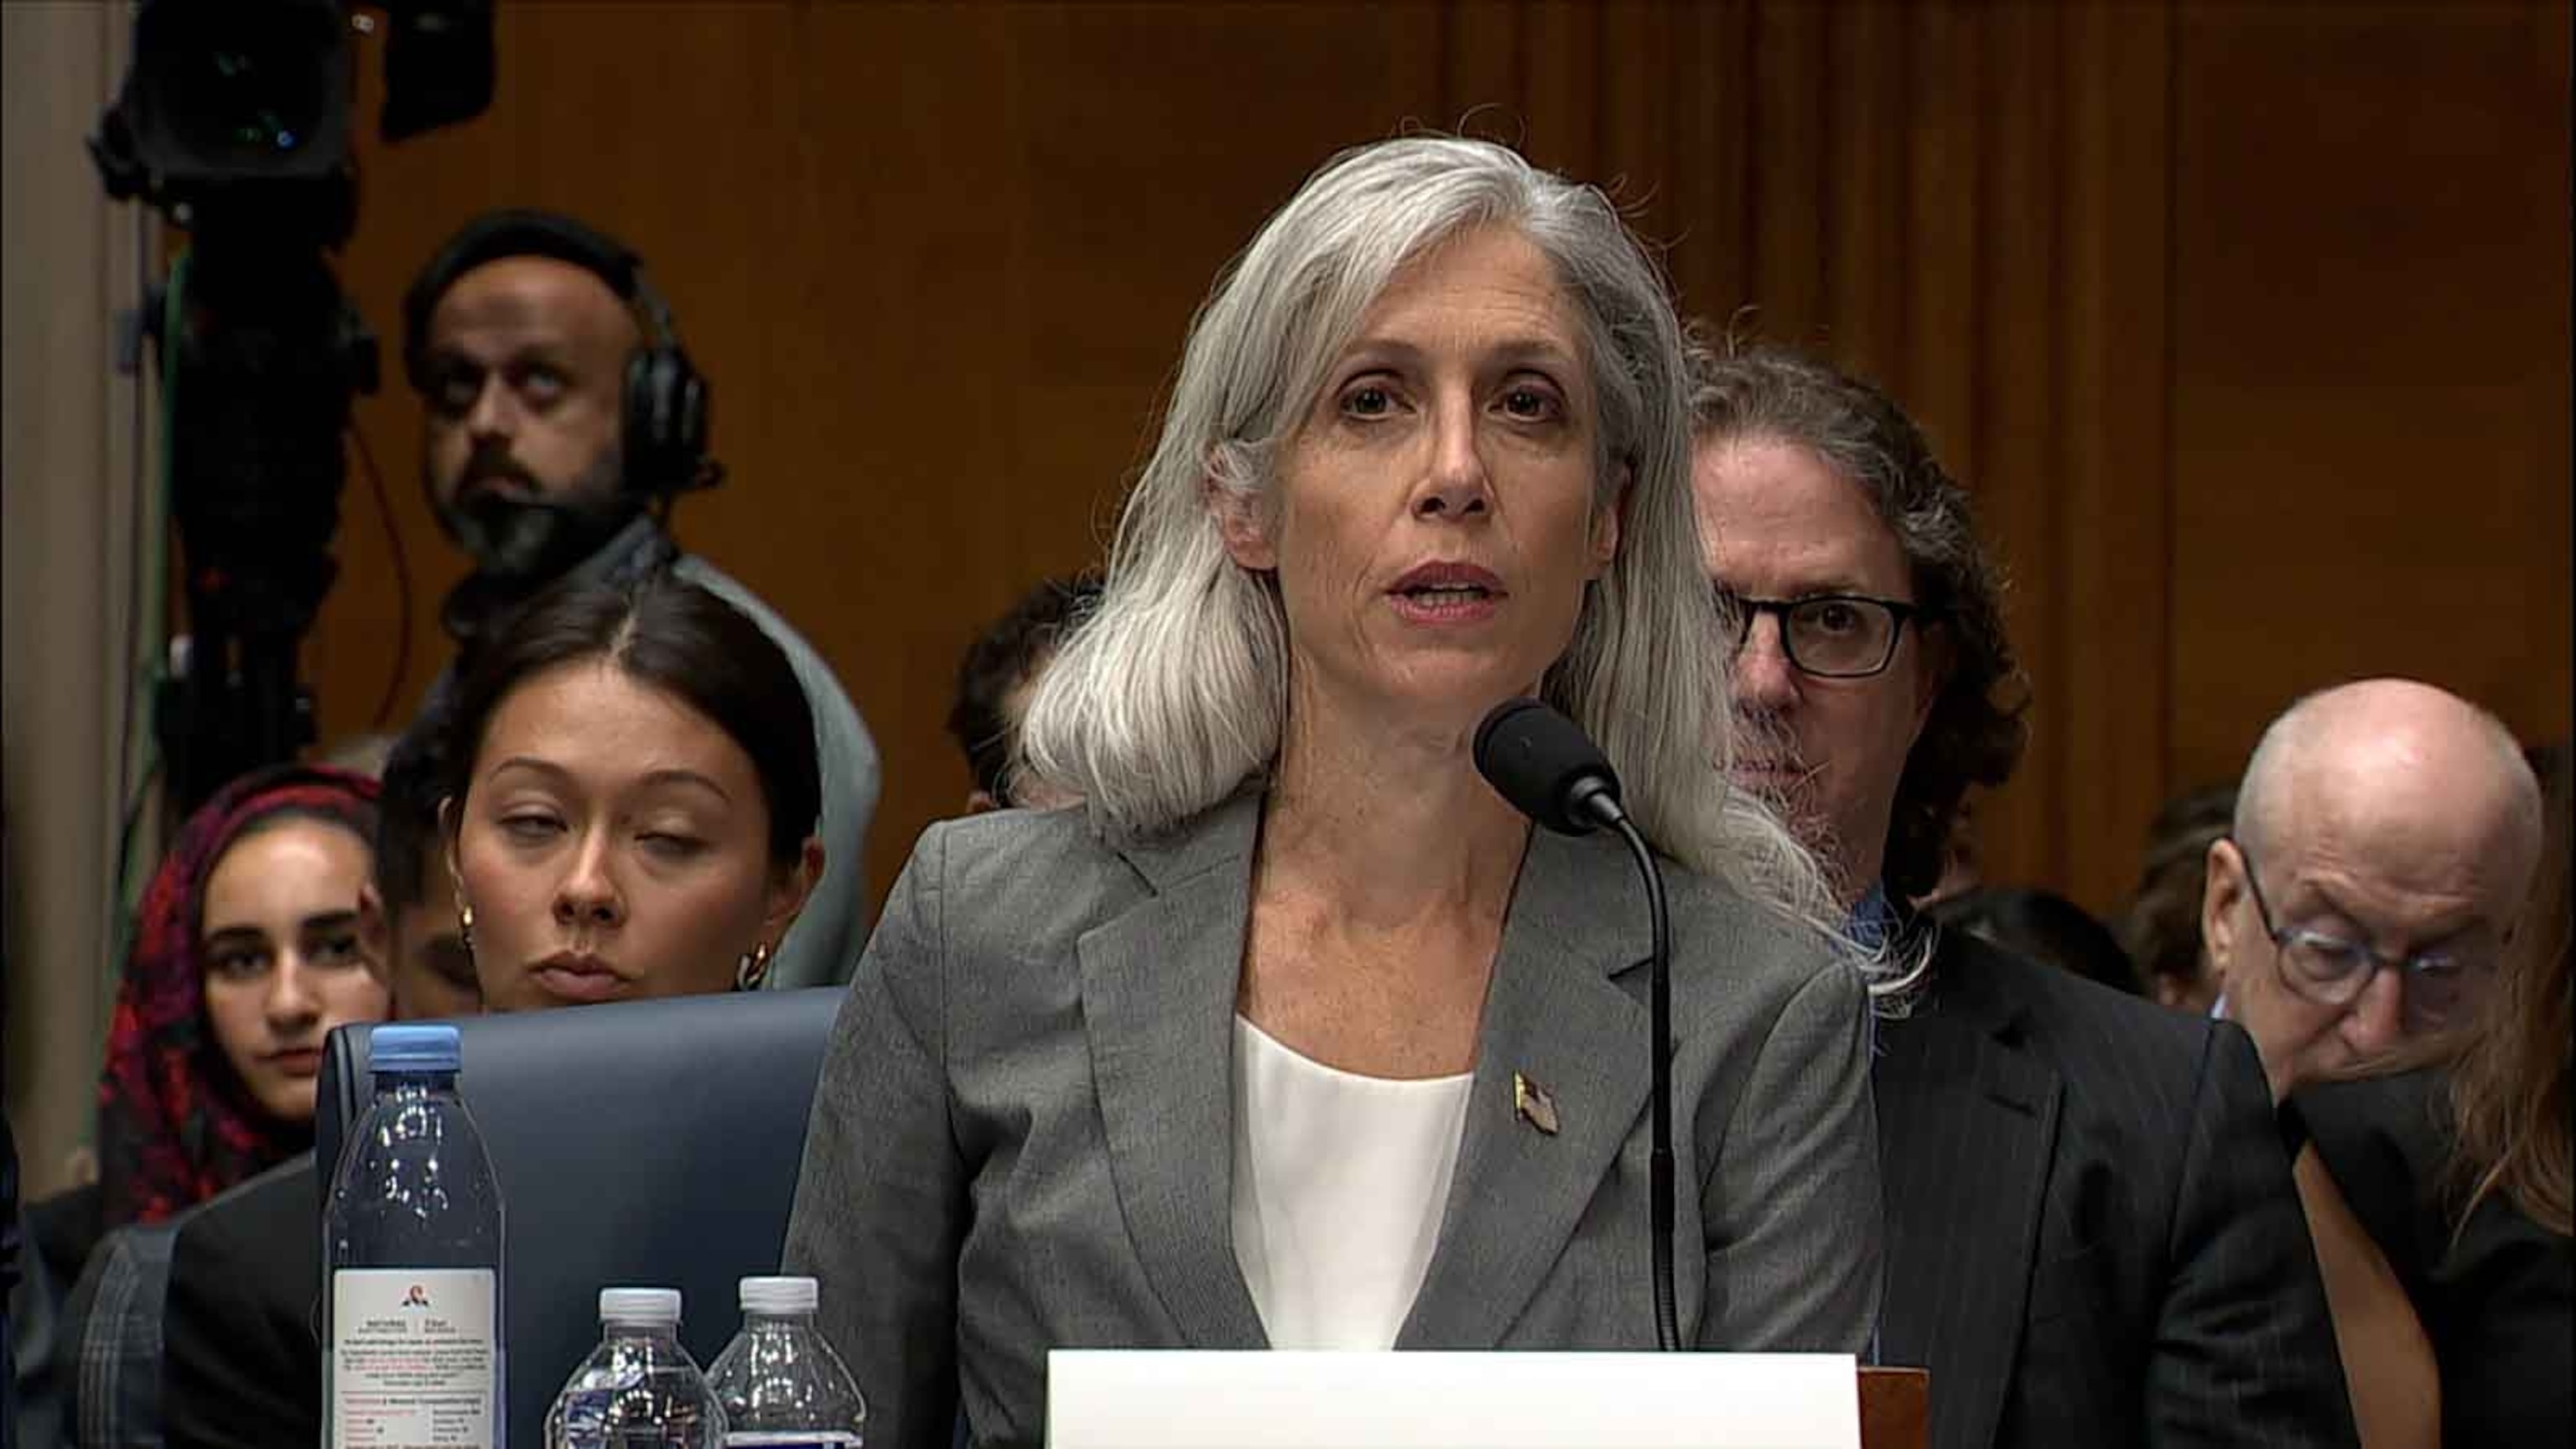
5:55
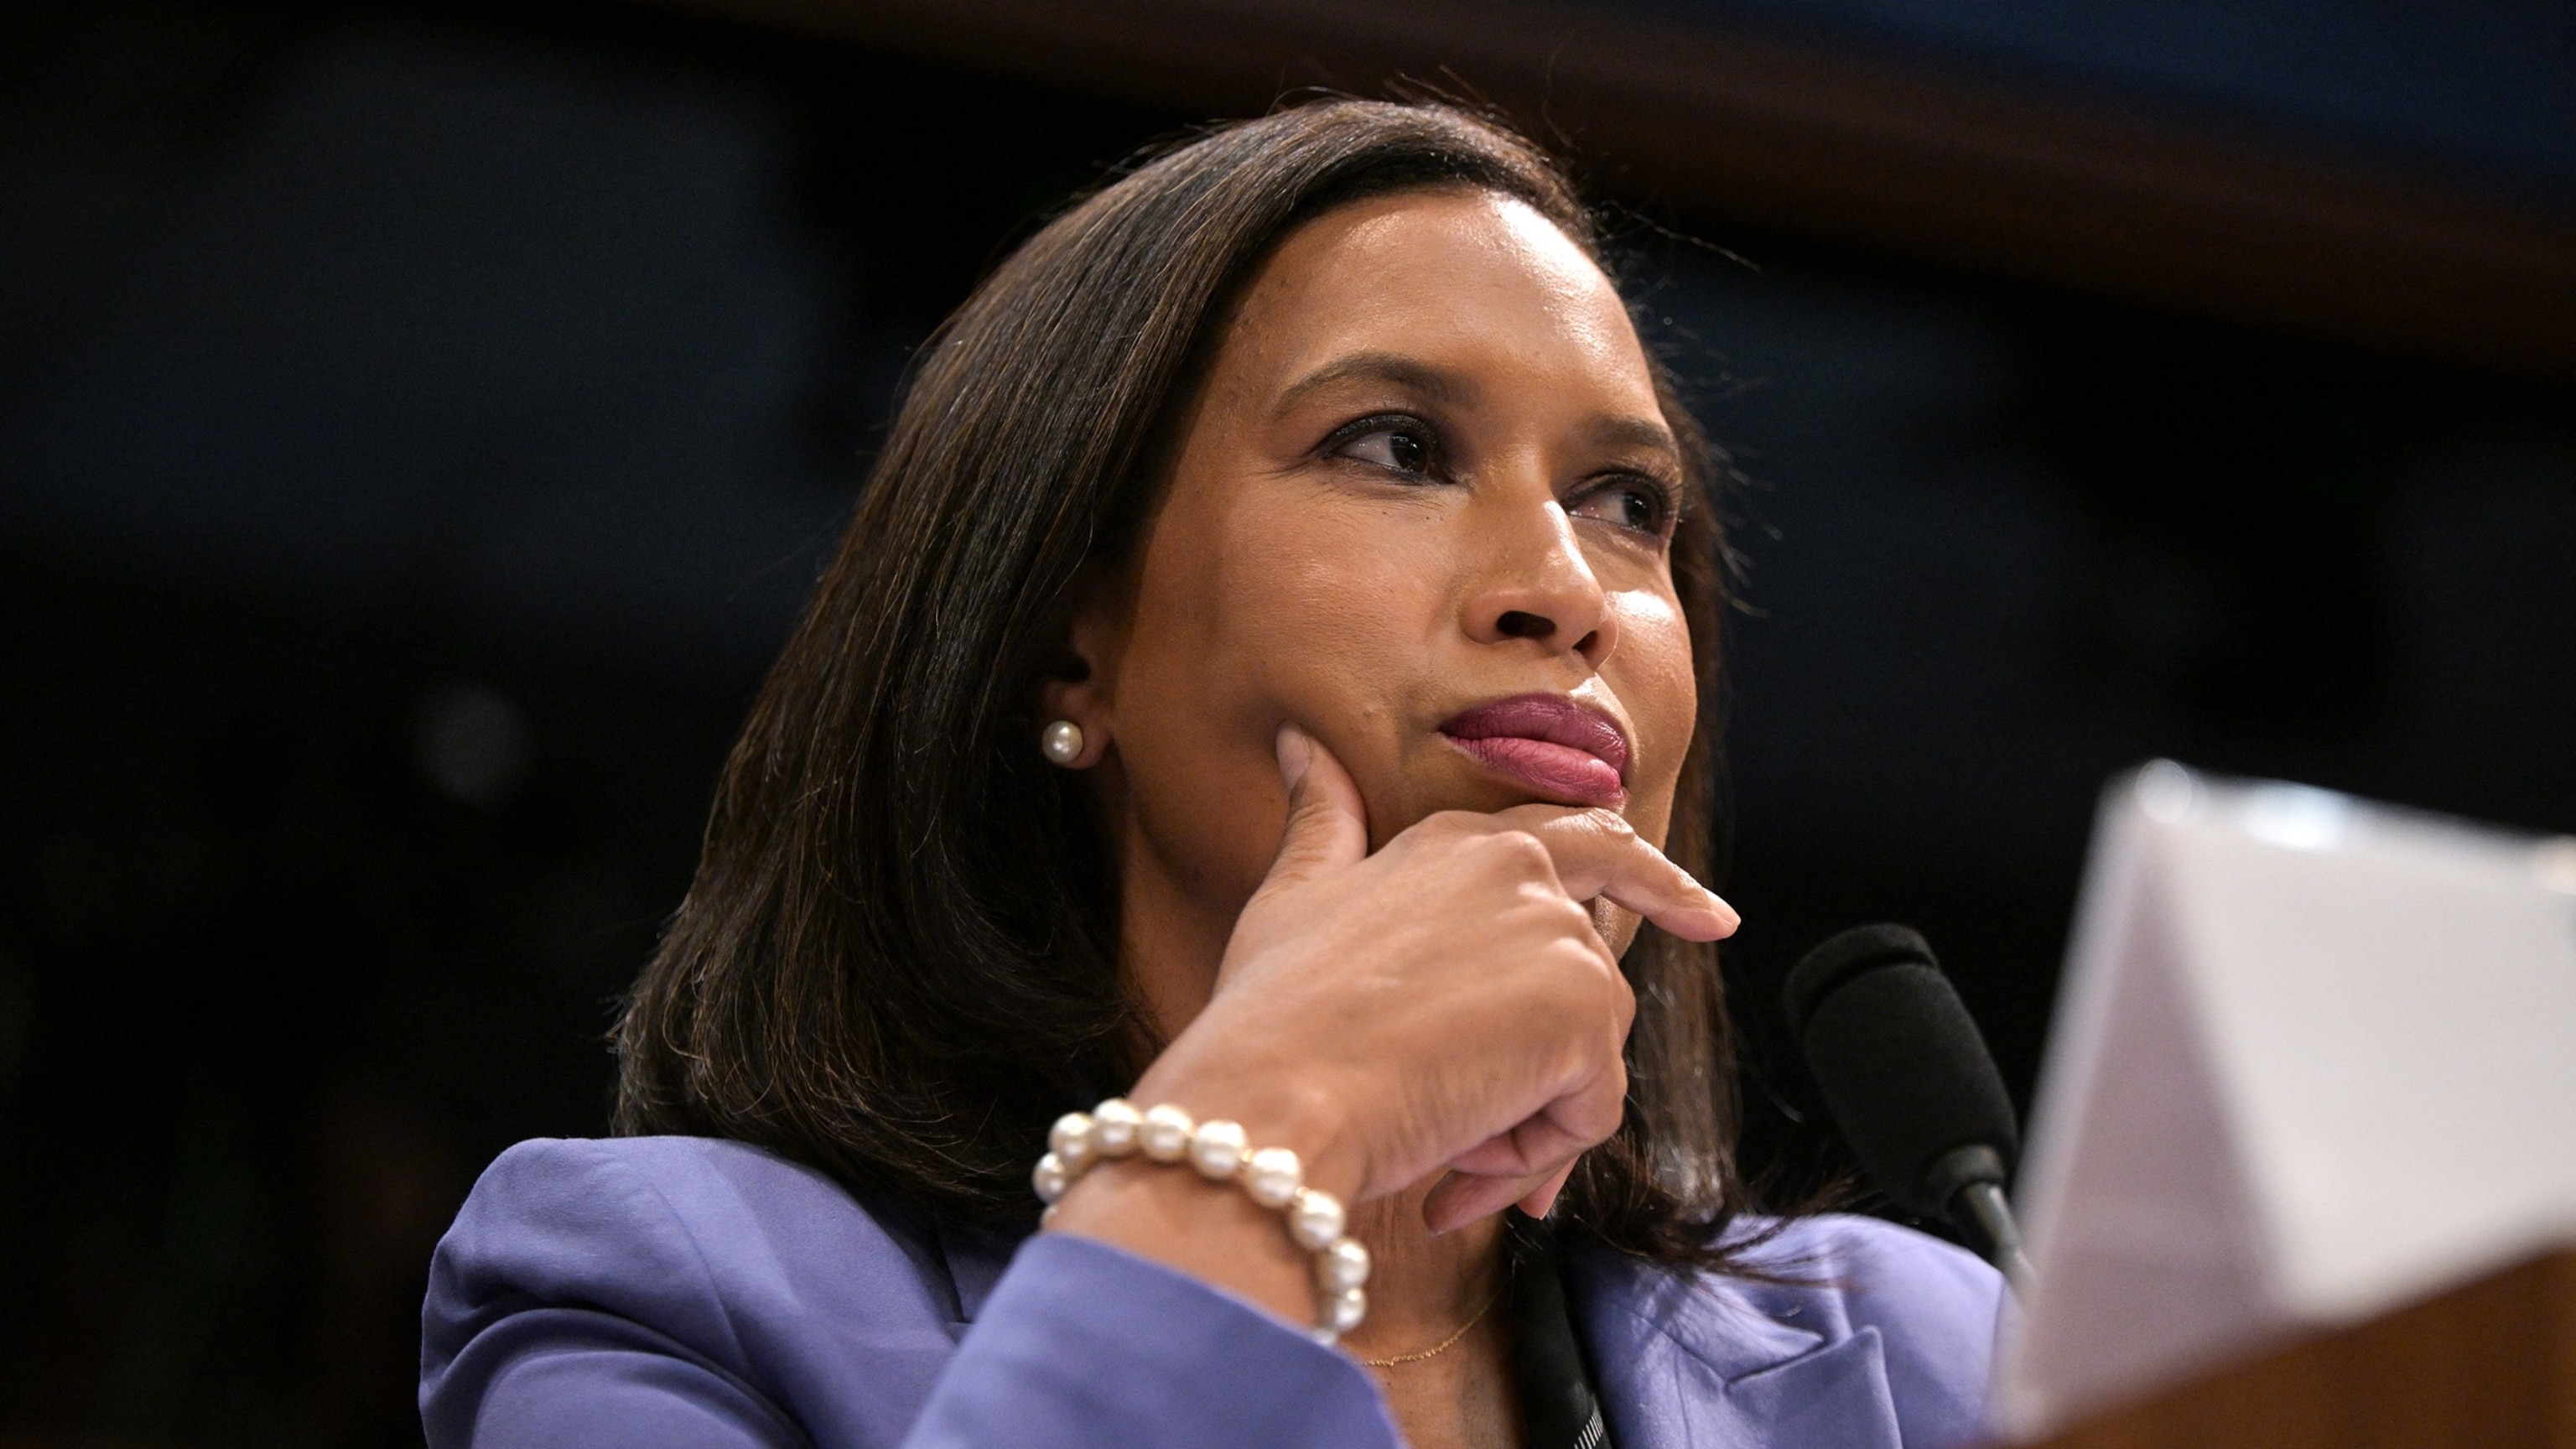
CDC has 'leadership vacuum': Former deputy director
- 1 day ago
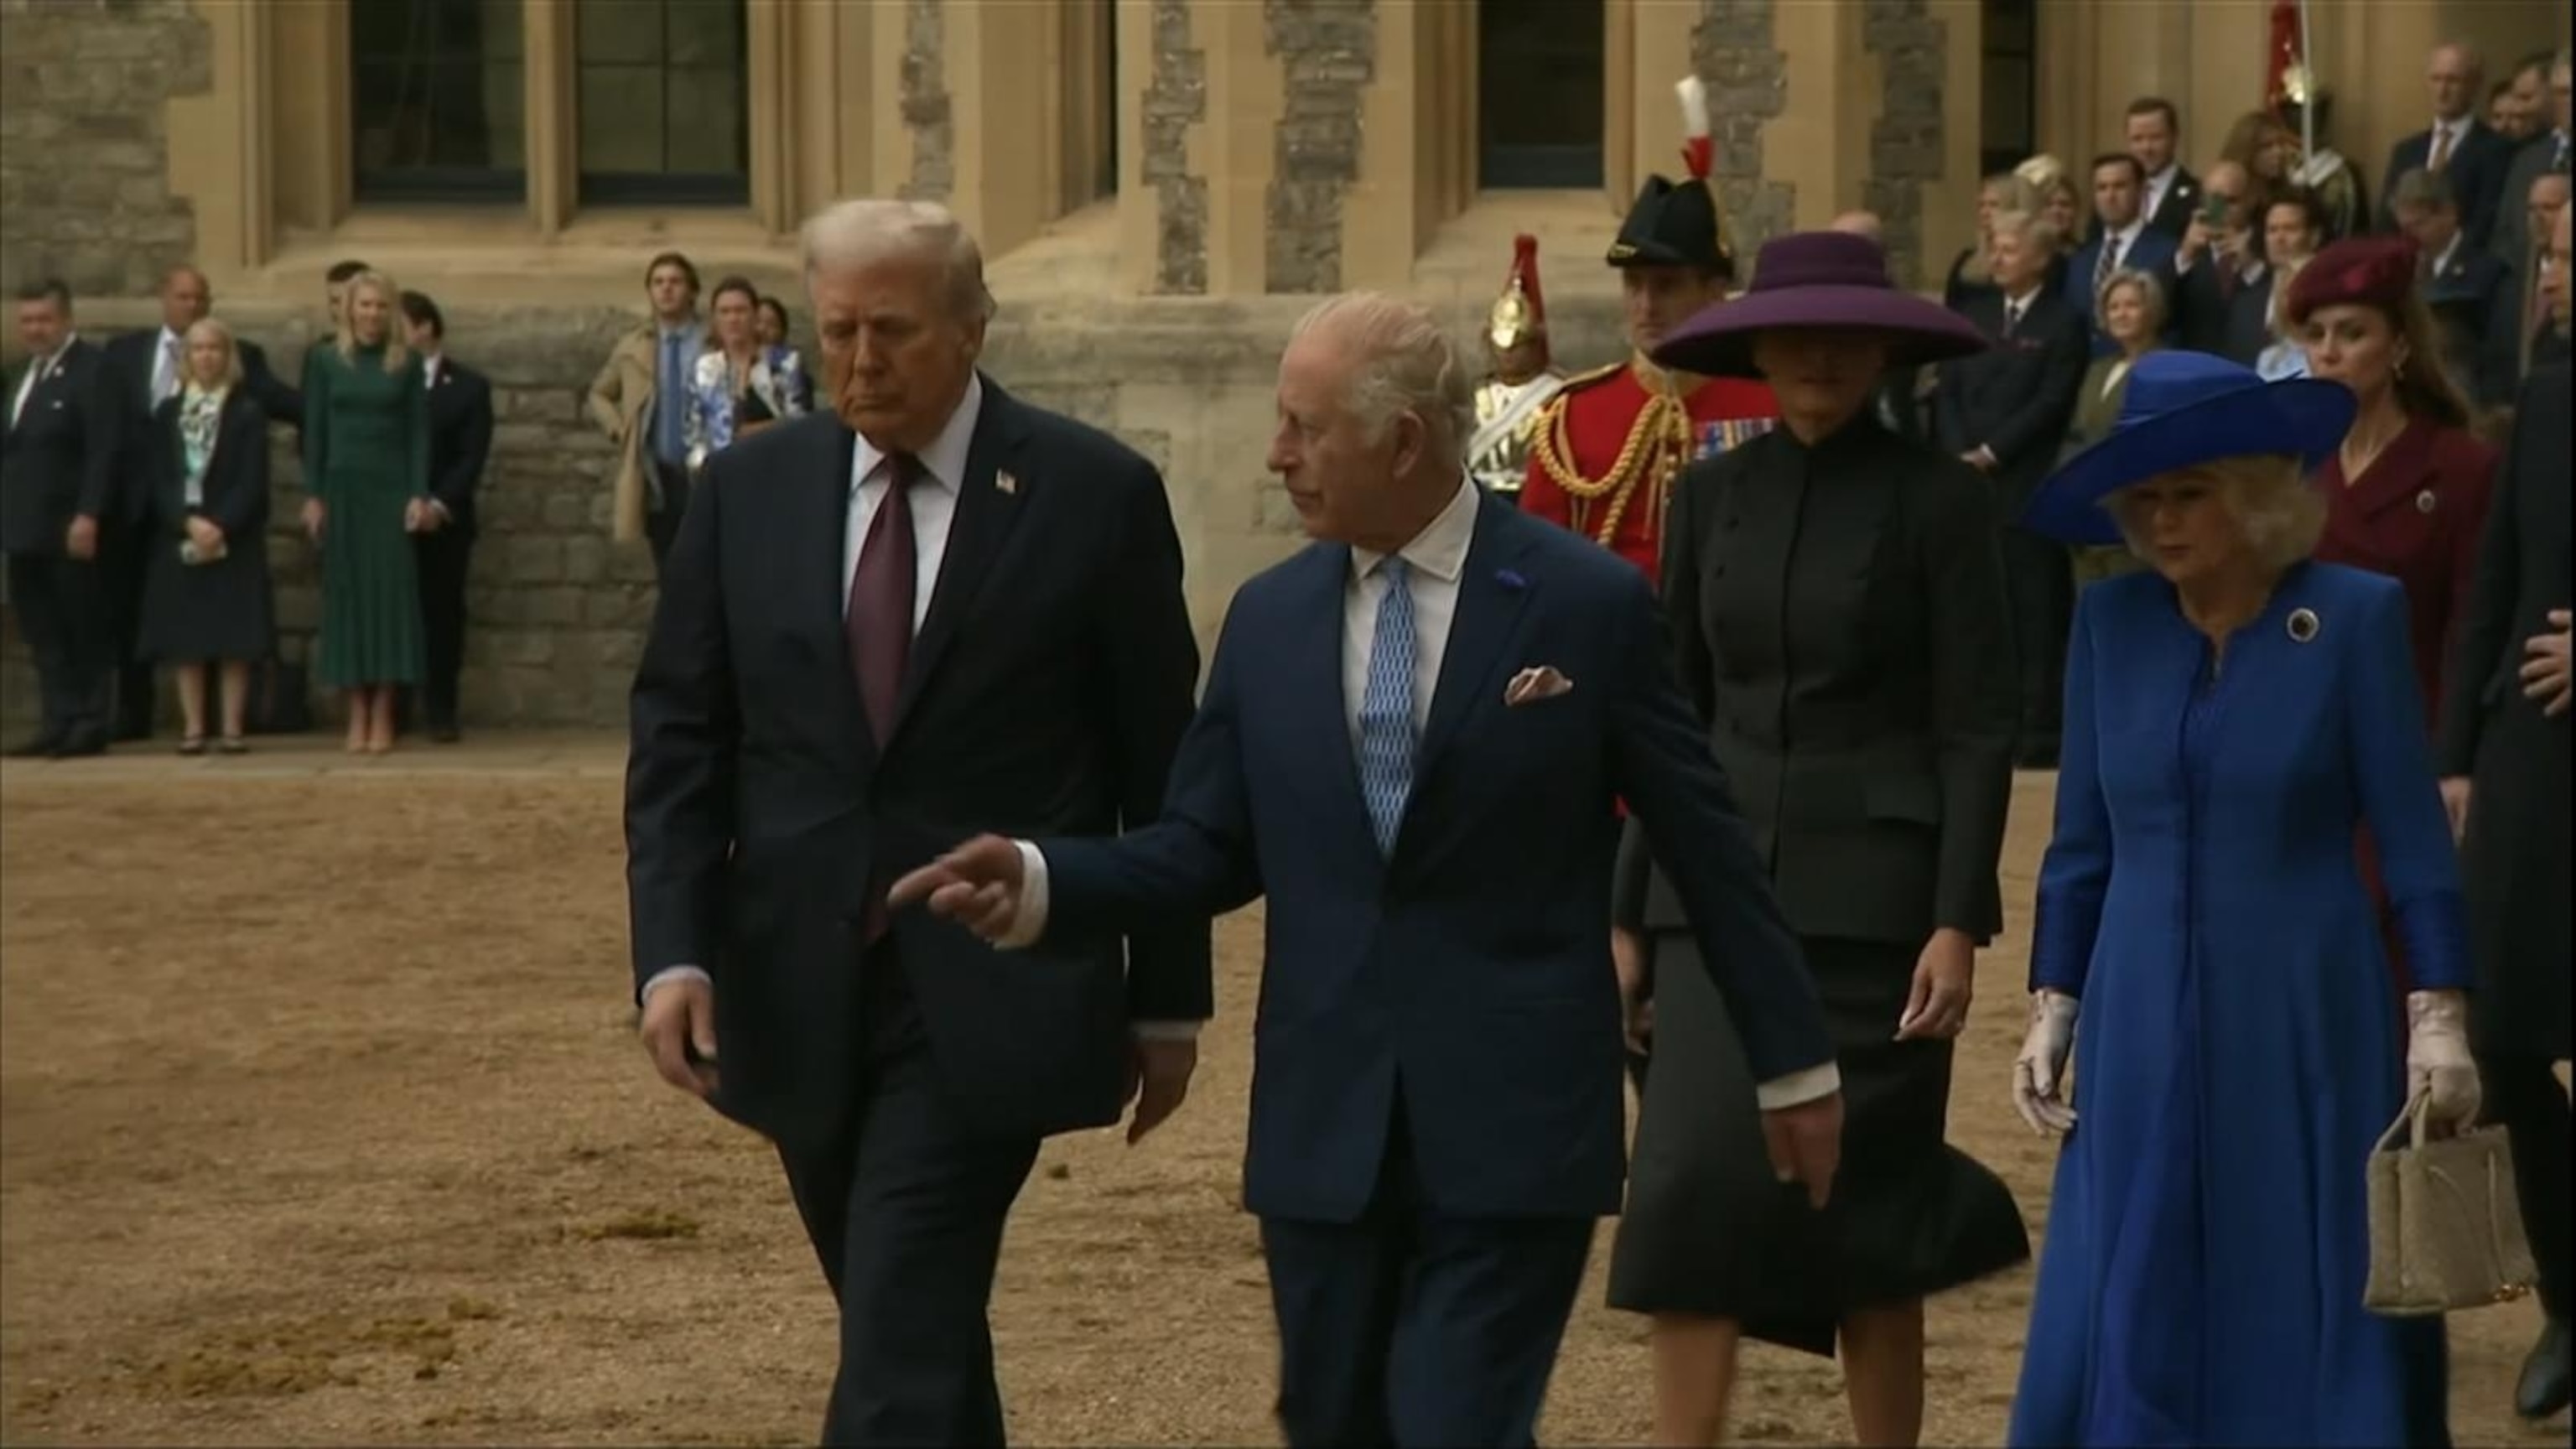
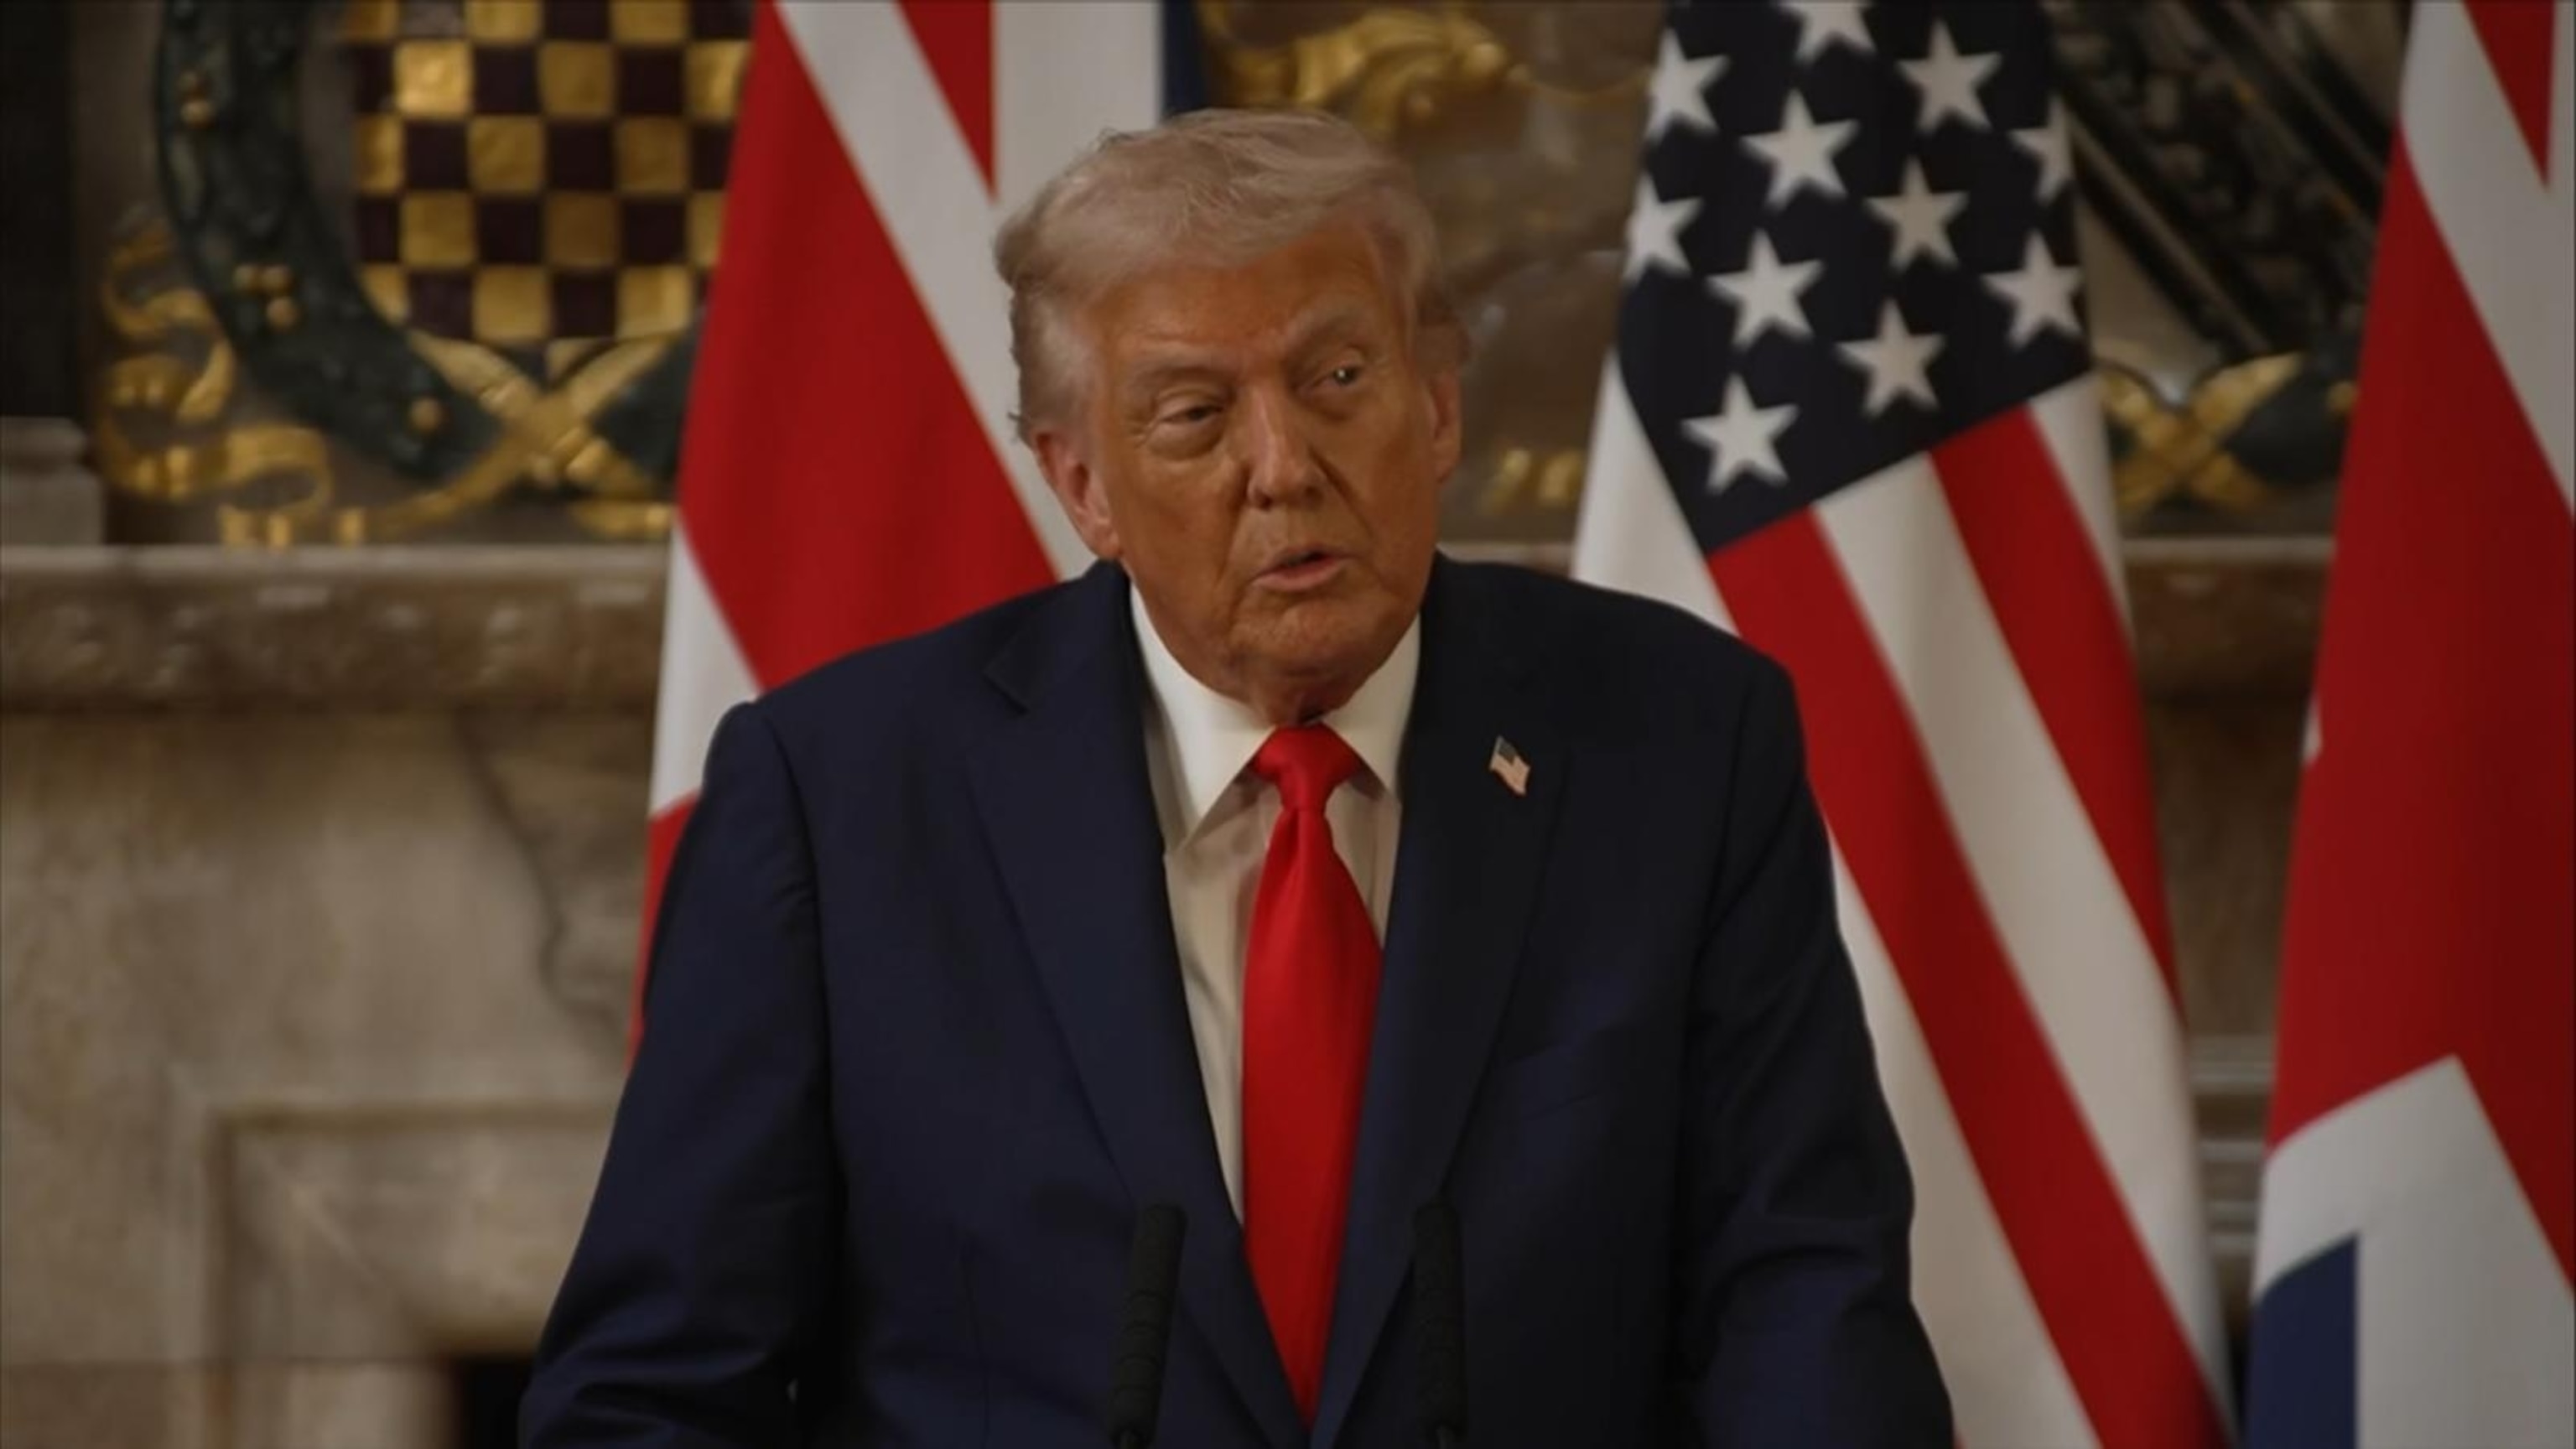
5:19
Trump greeted by king, thousands of protesters in UK visit
- 1 day ago
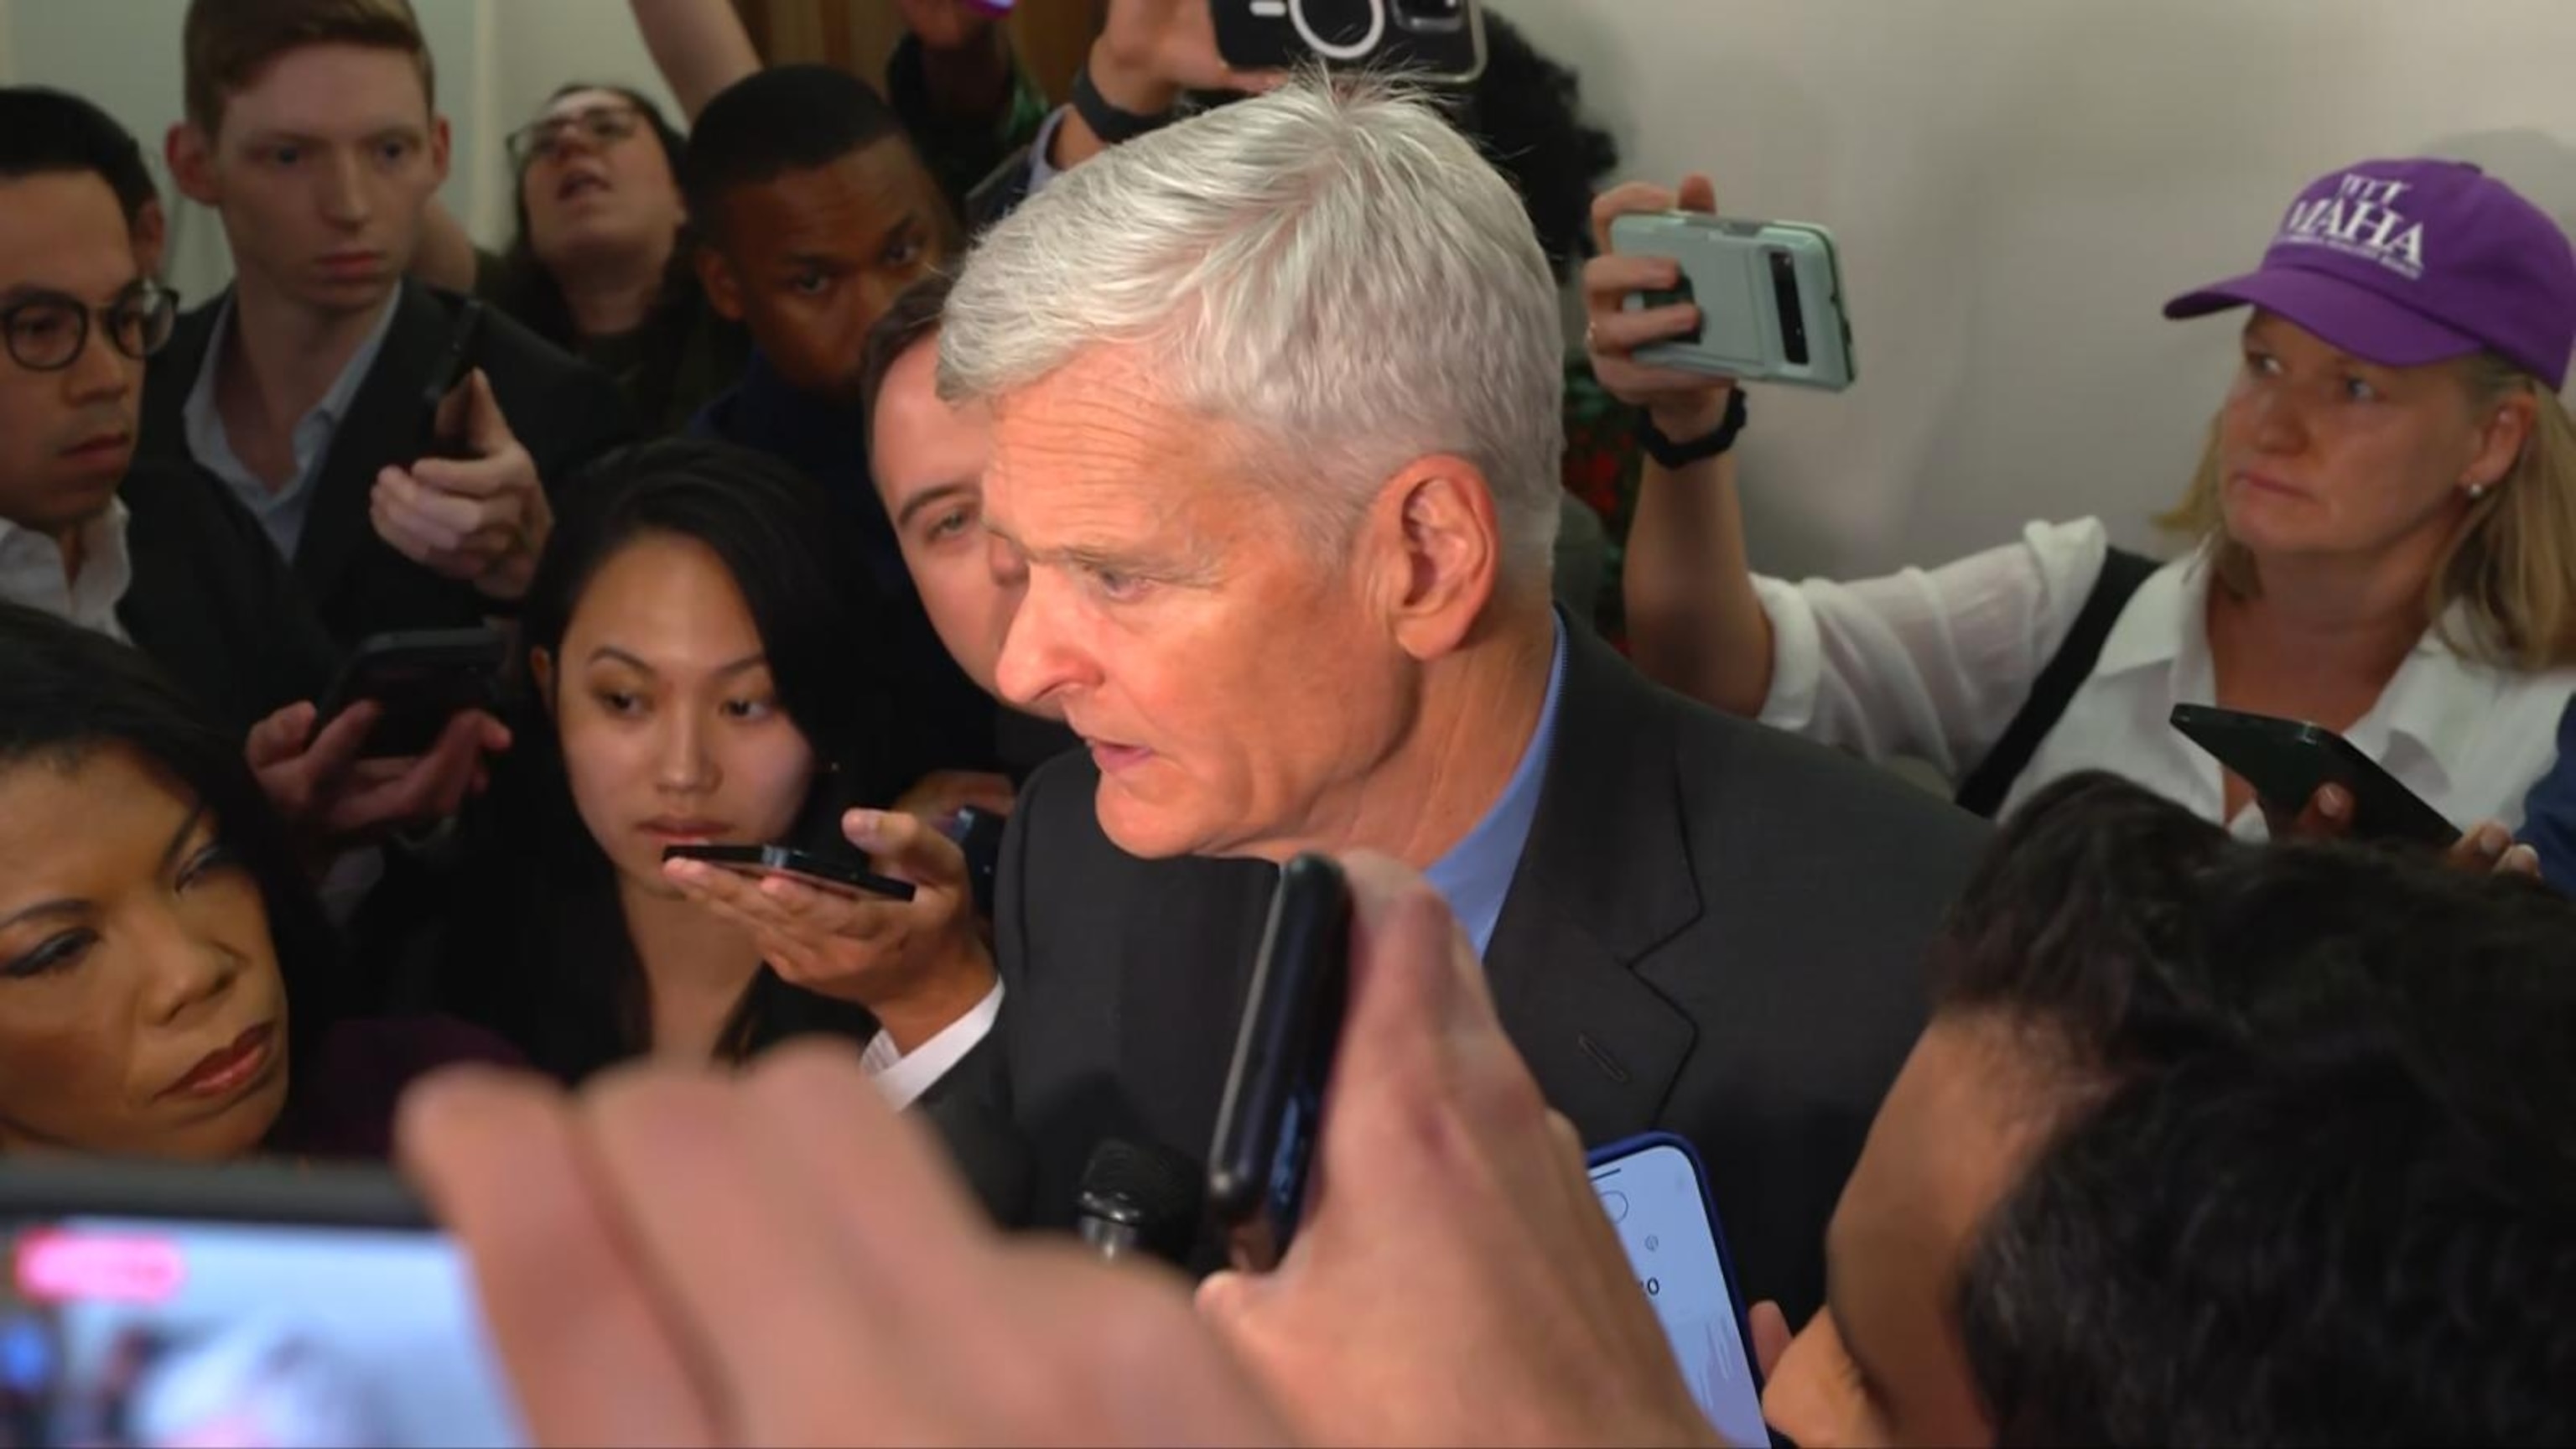
6:07
Sen. Bill Cassidy speaks after fired CDC director's hearing
- 1 day ago
Playlist · 10 Videos