Political News
Latest Videos
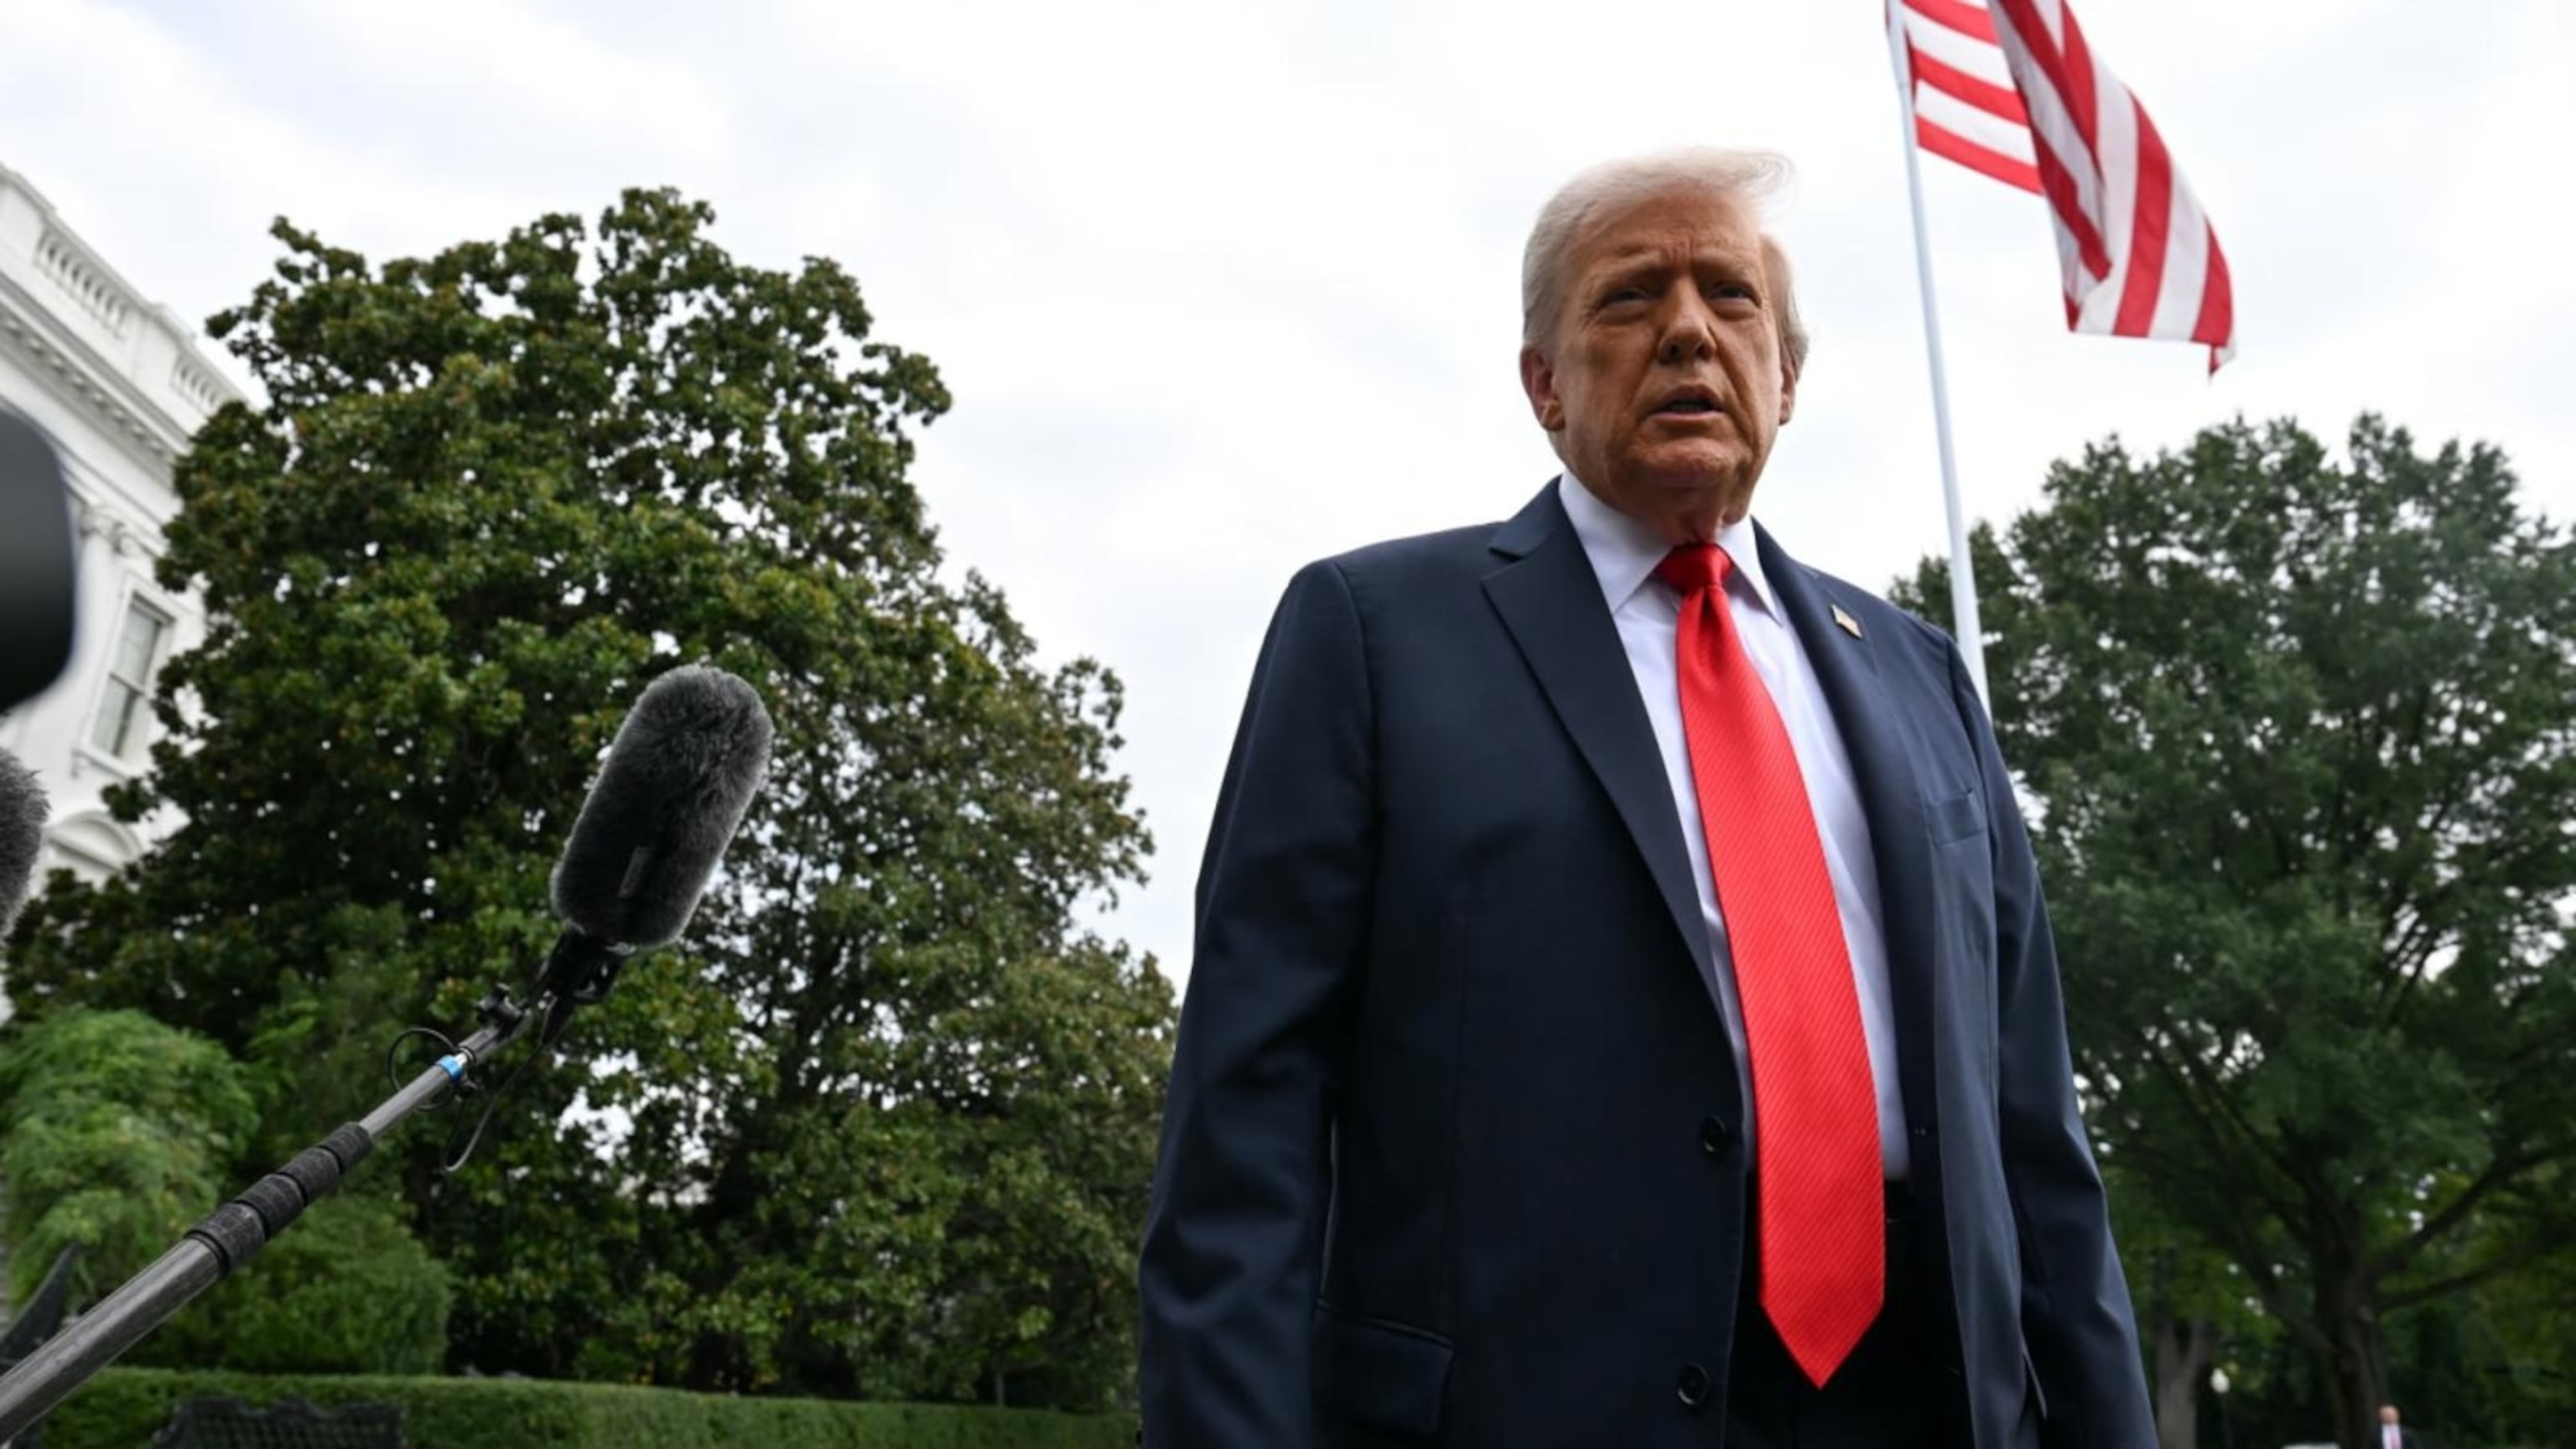
3:27
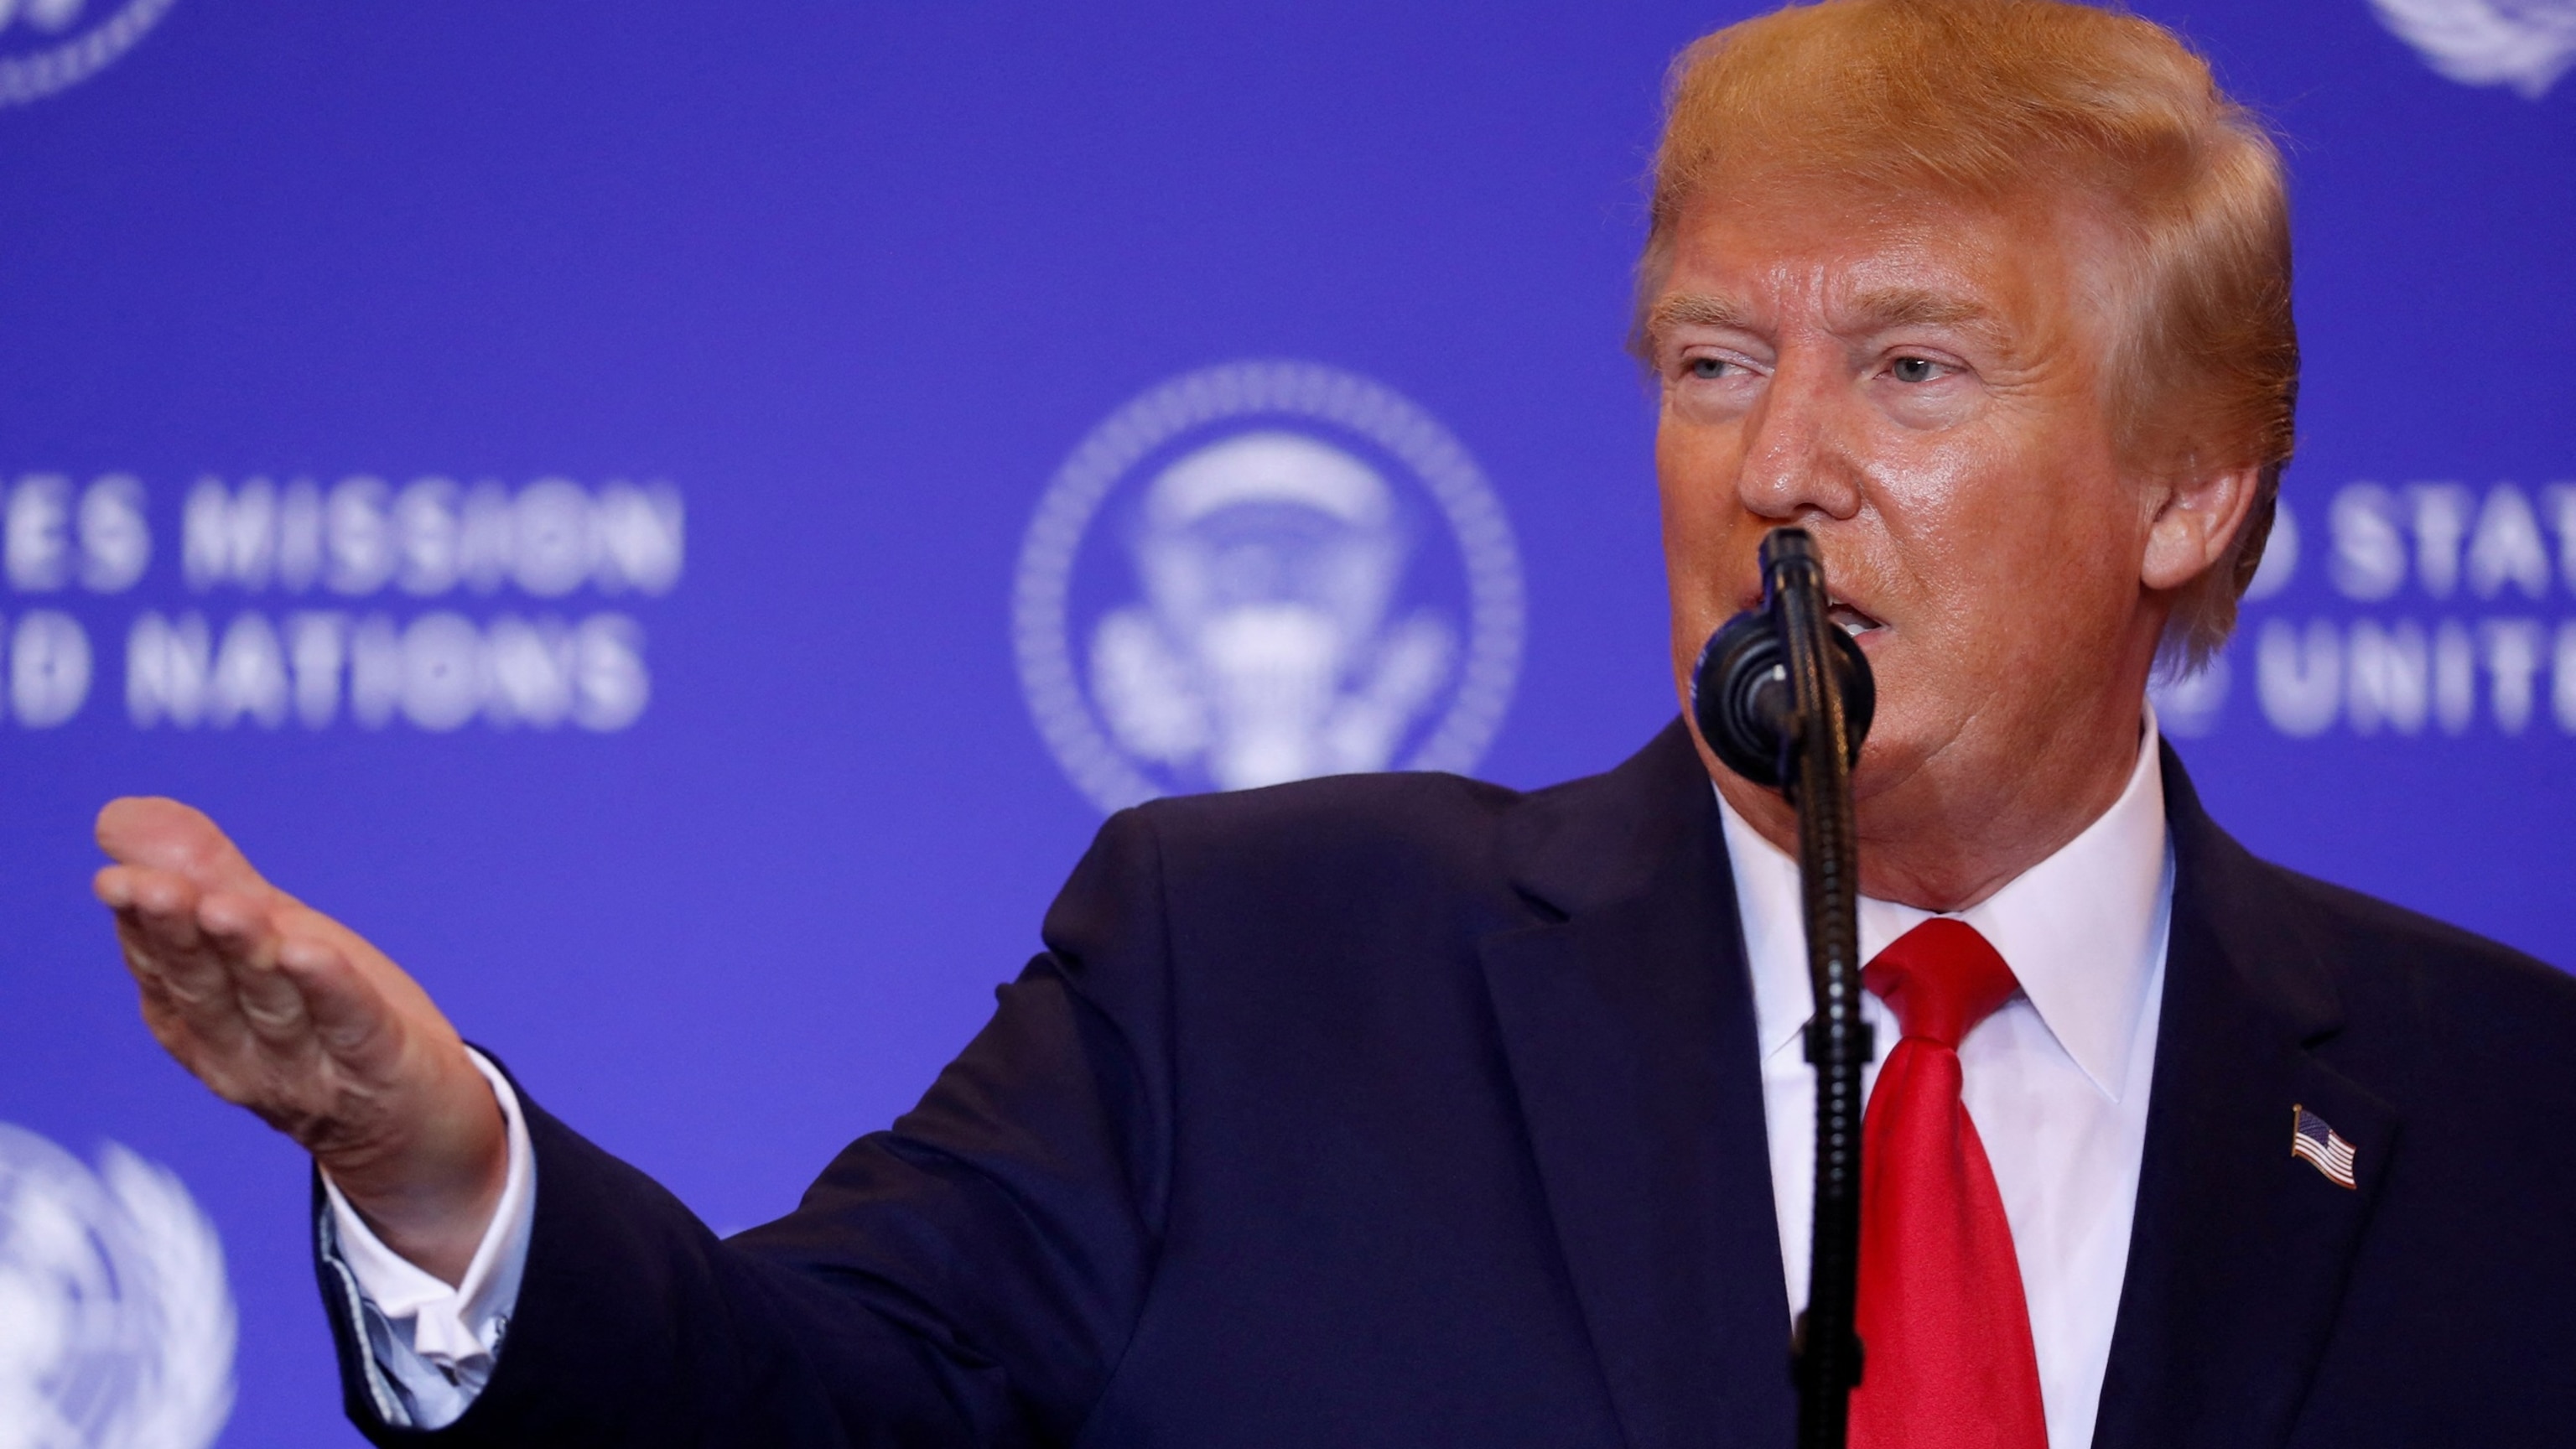
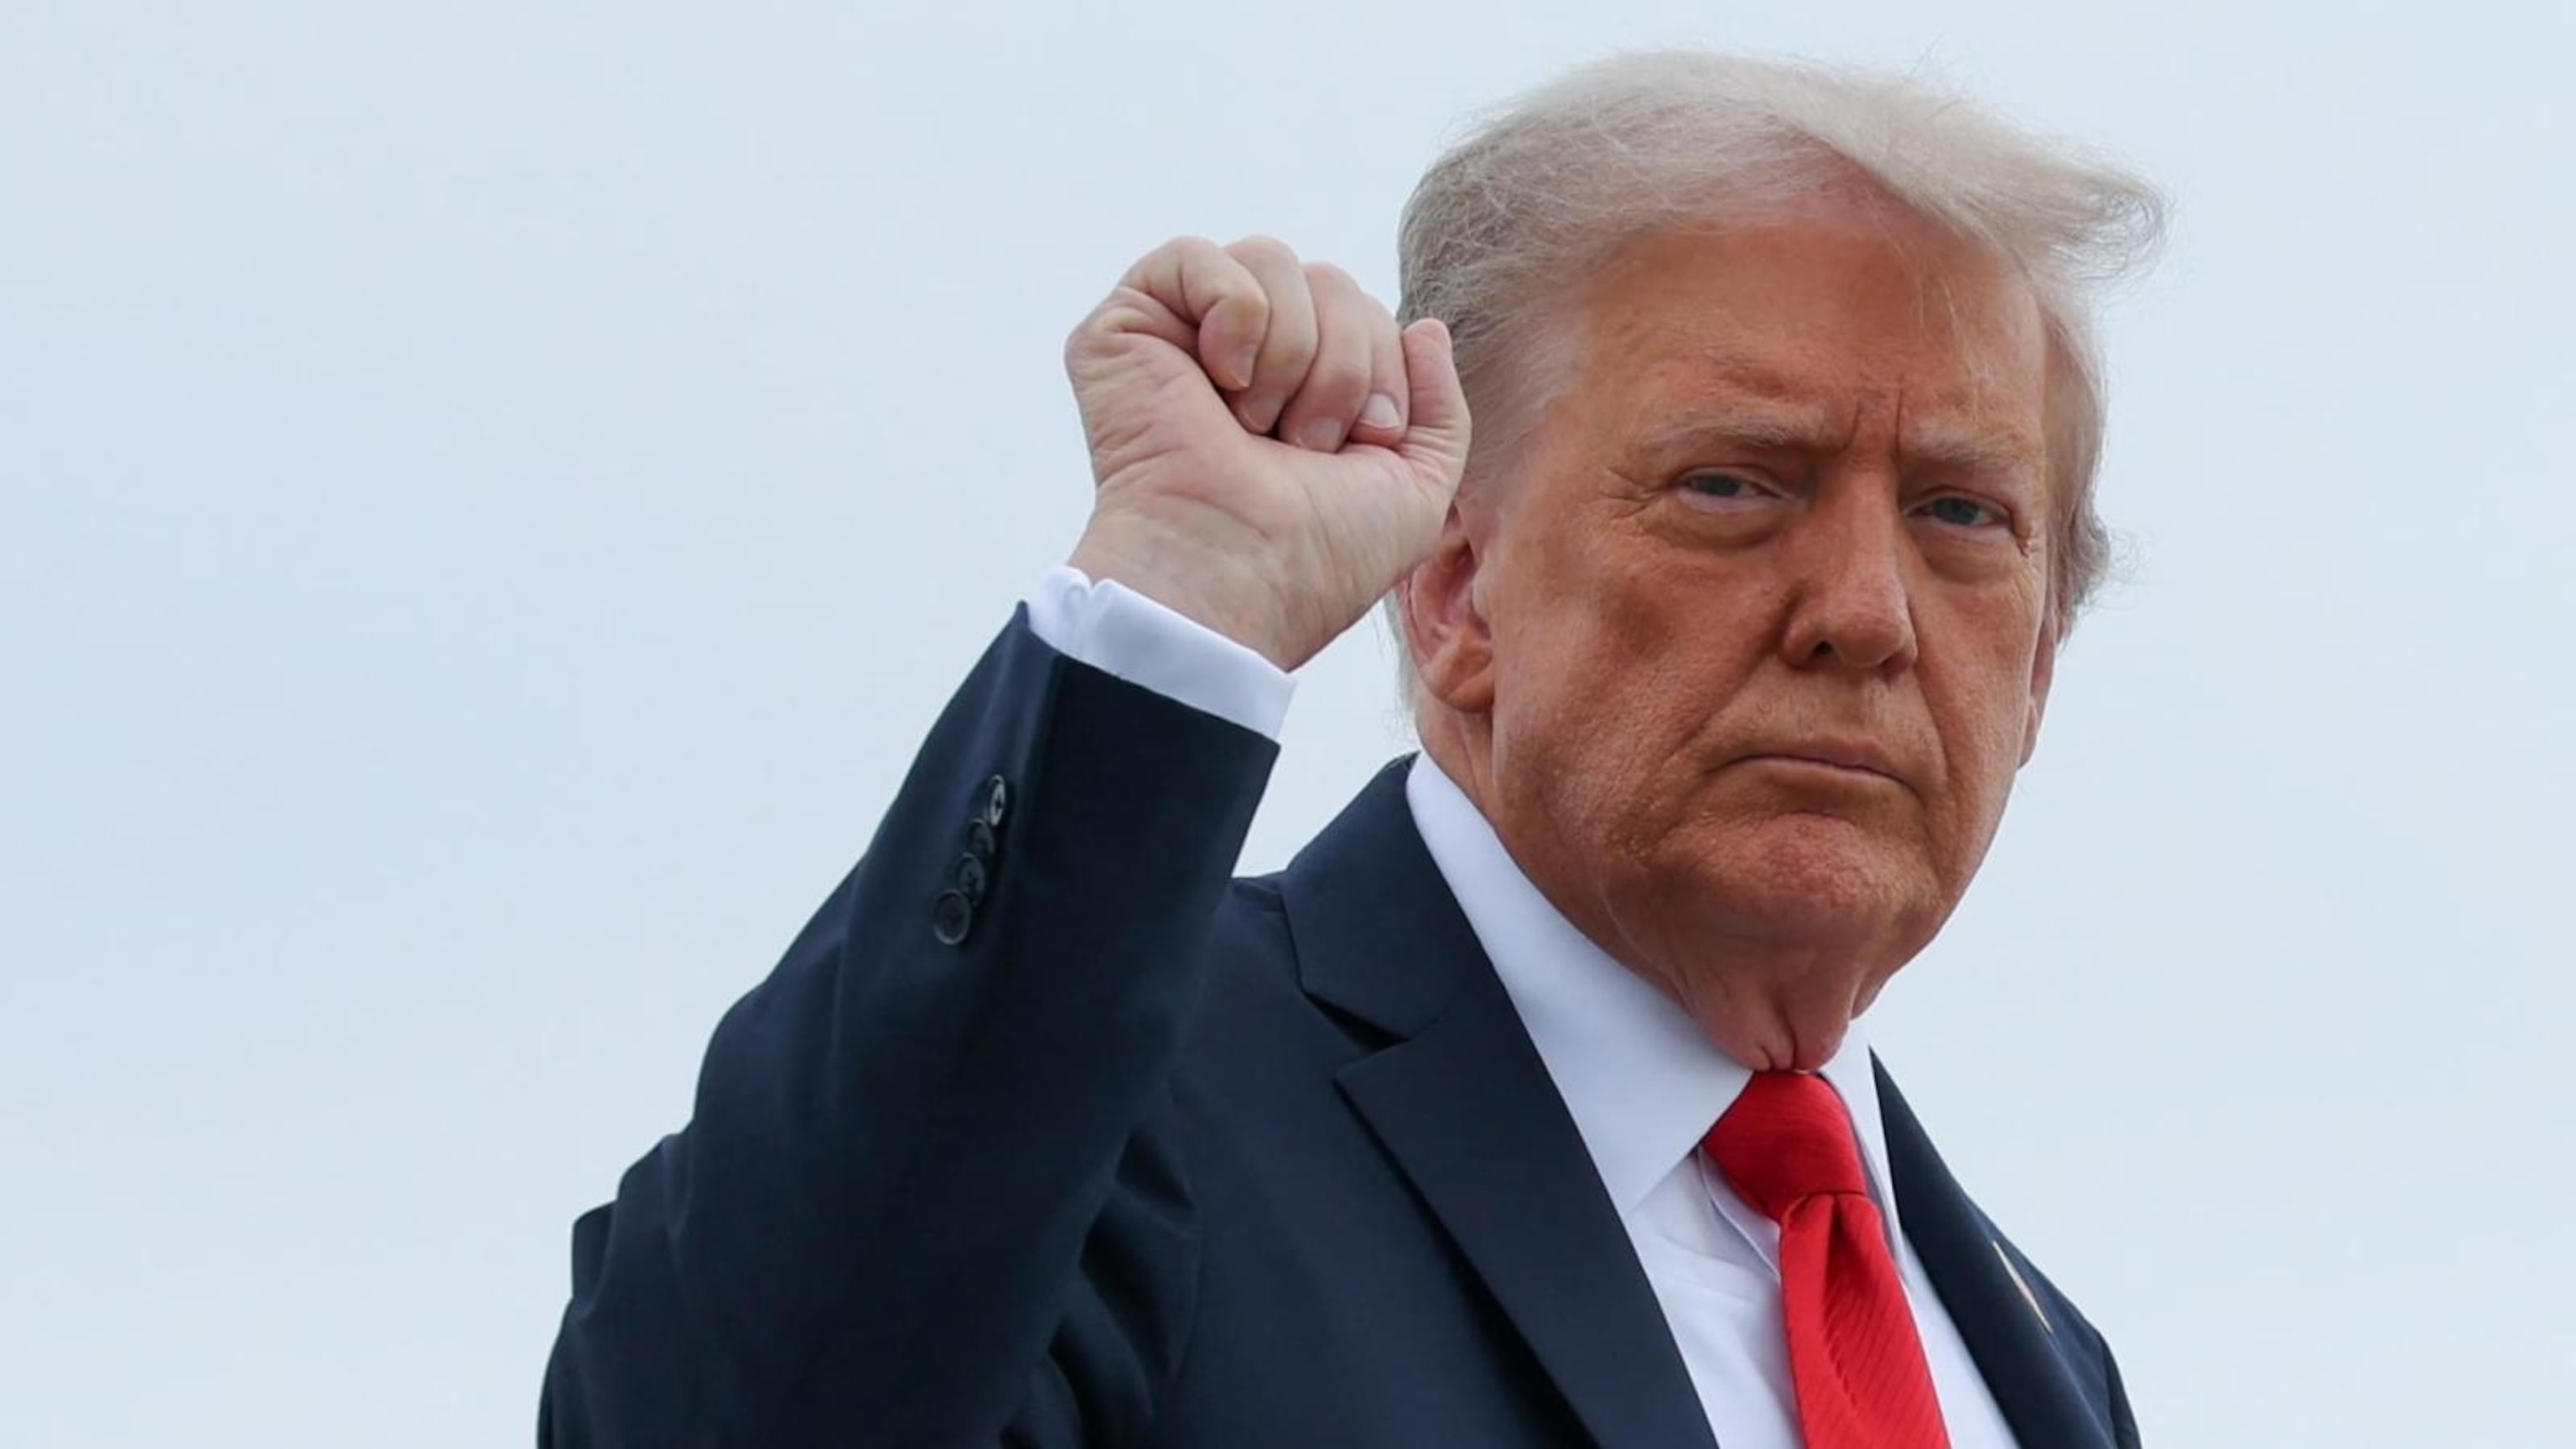
Trump appears to criticize Bondi over investigations of political opponents
- 14 hours ago
6:09
What to know about planned announcement by Trump on autism
- 15 hours ago
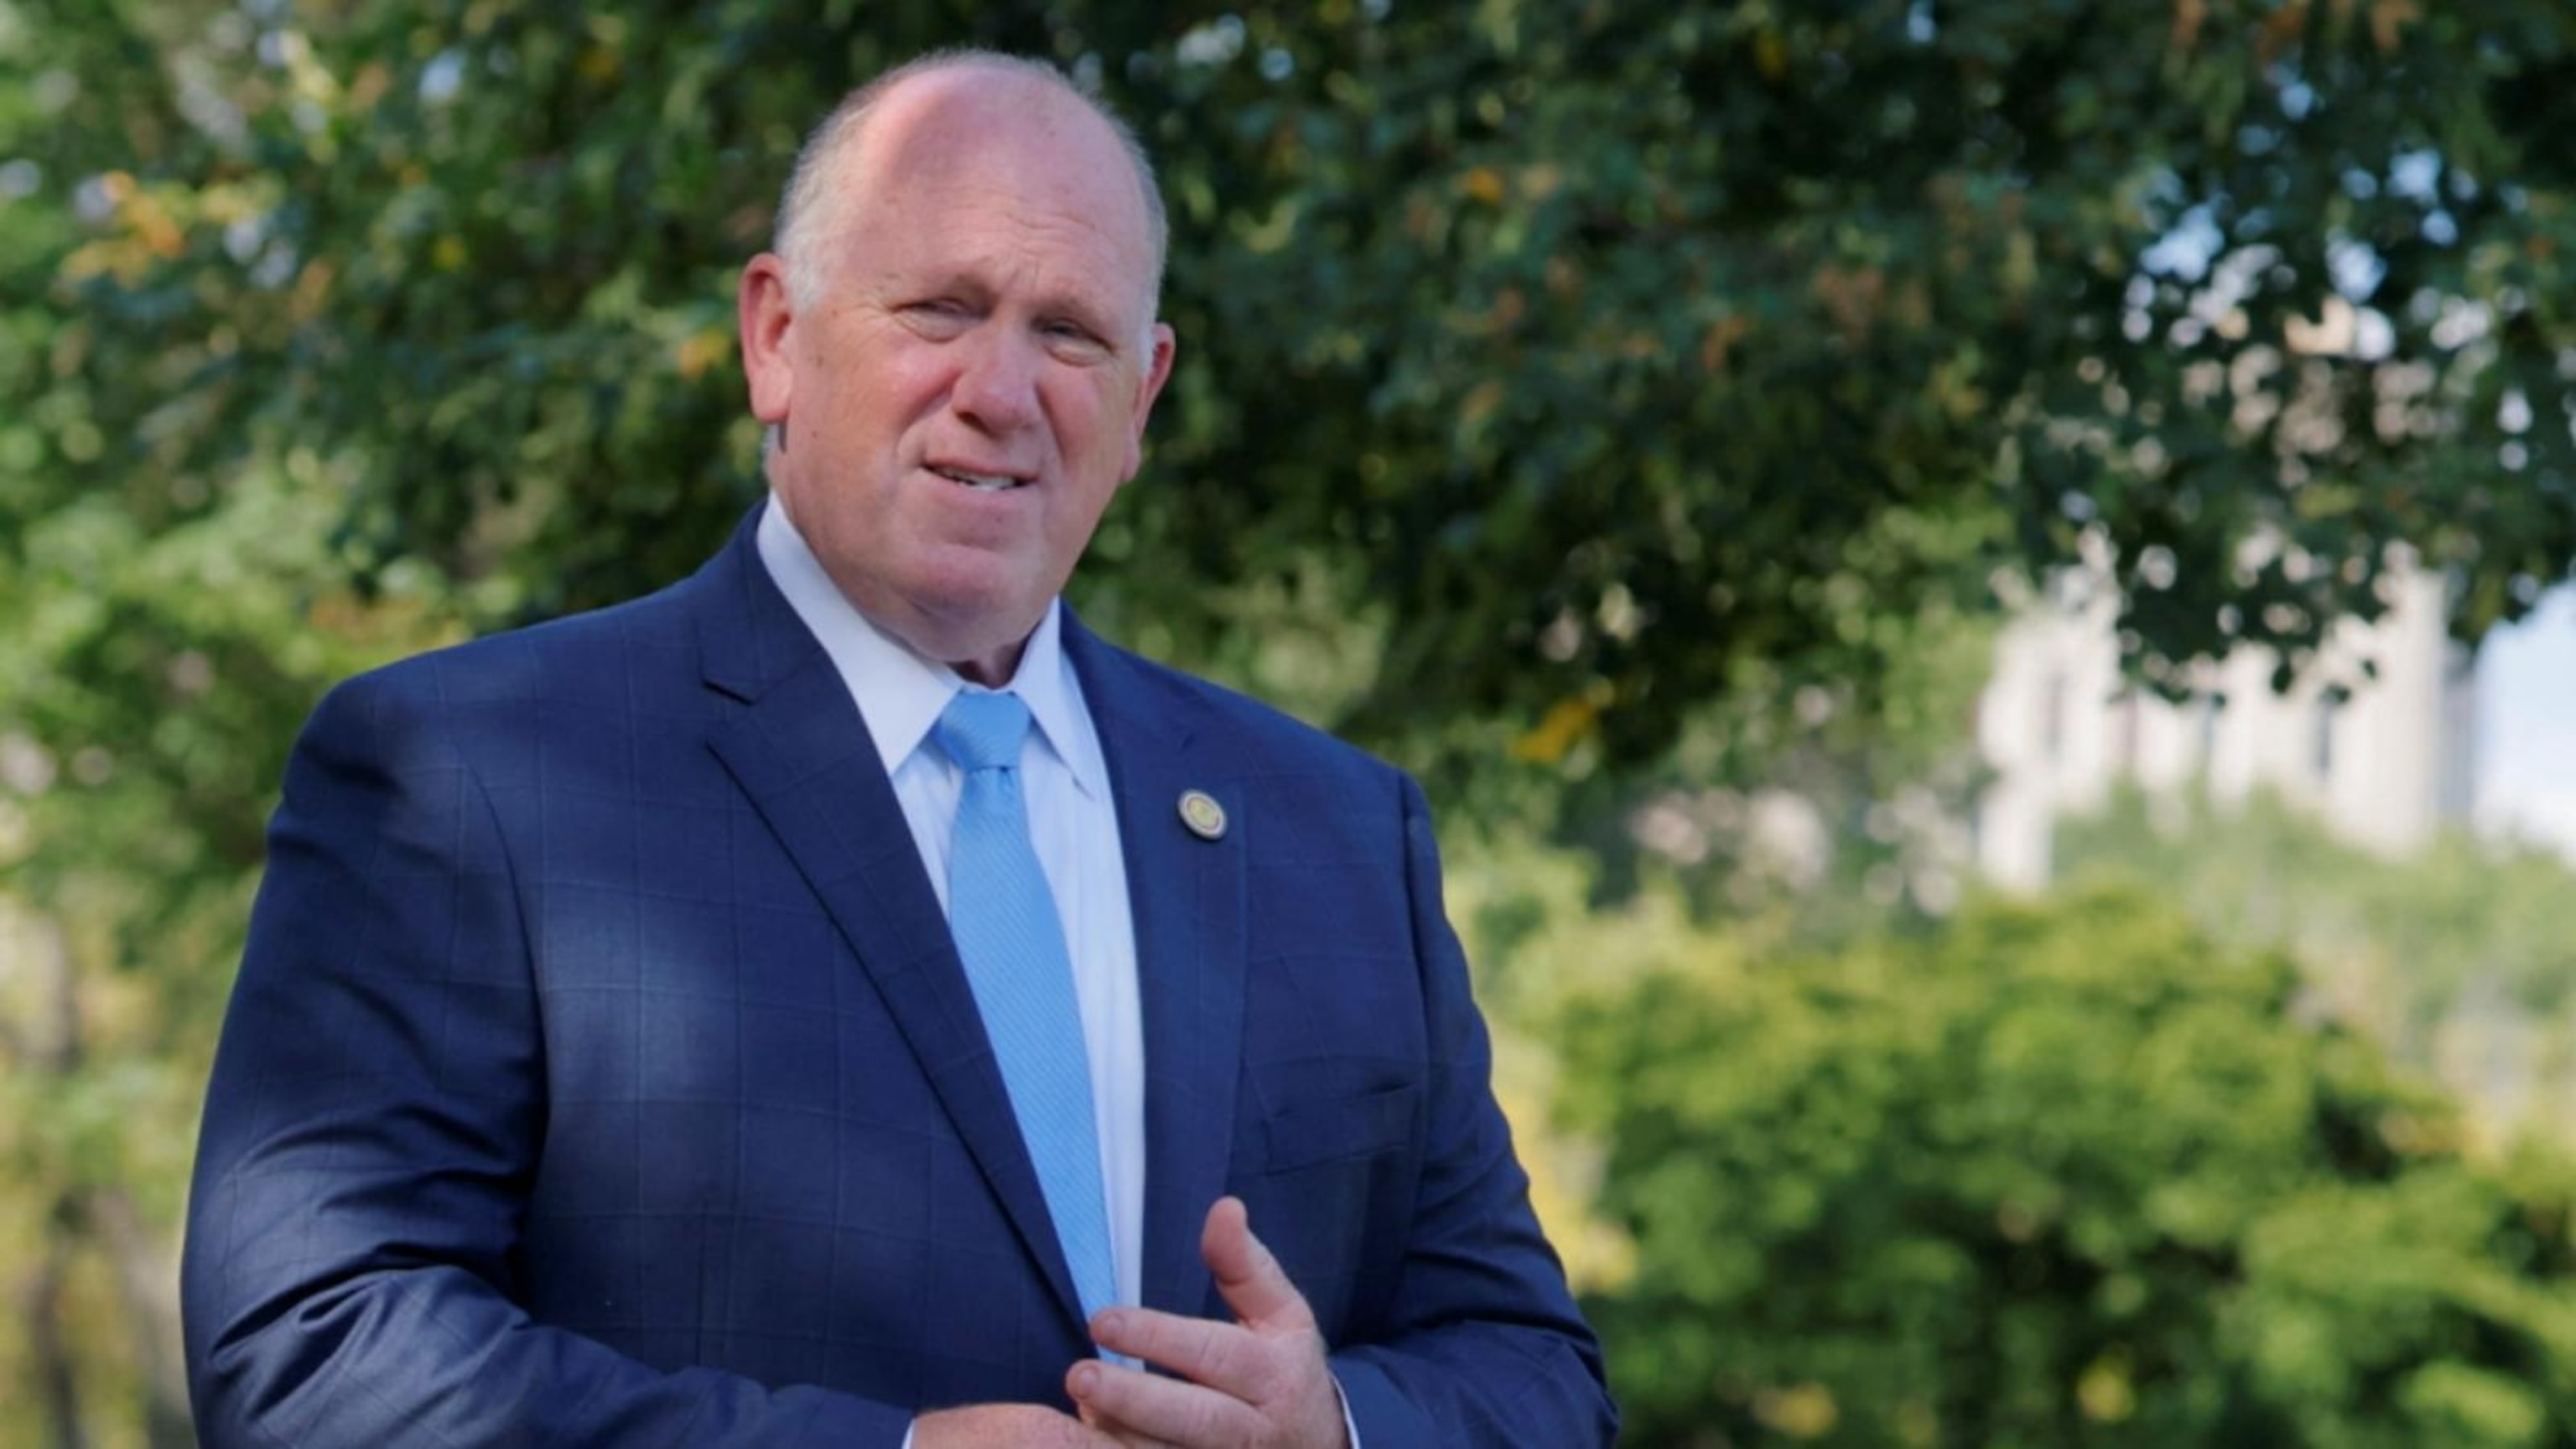
0:52
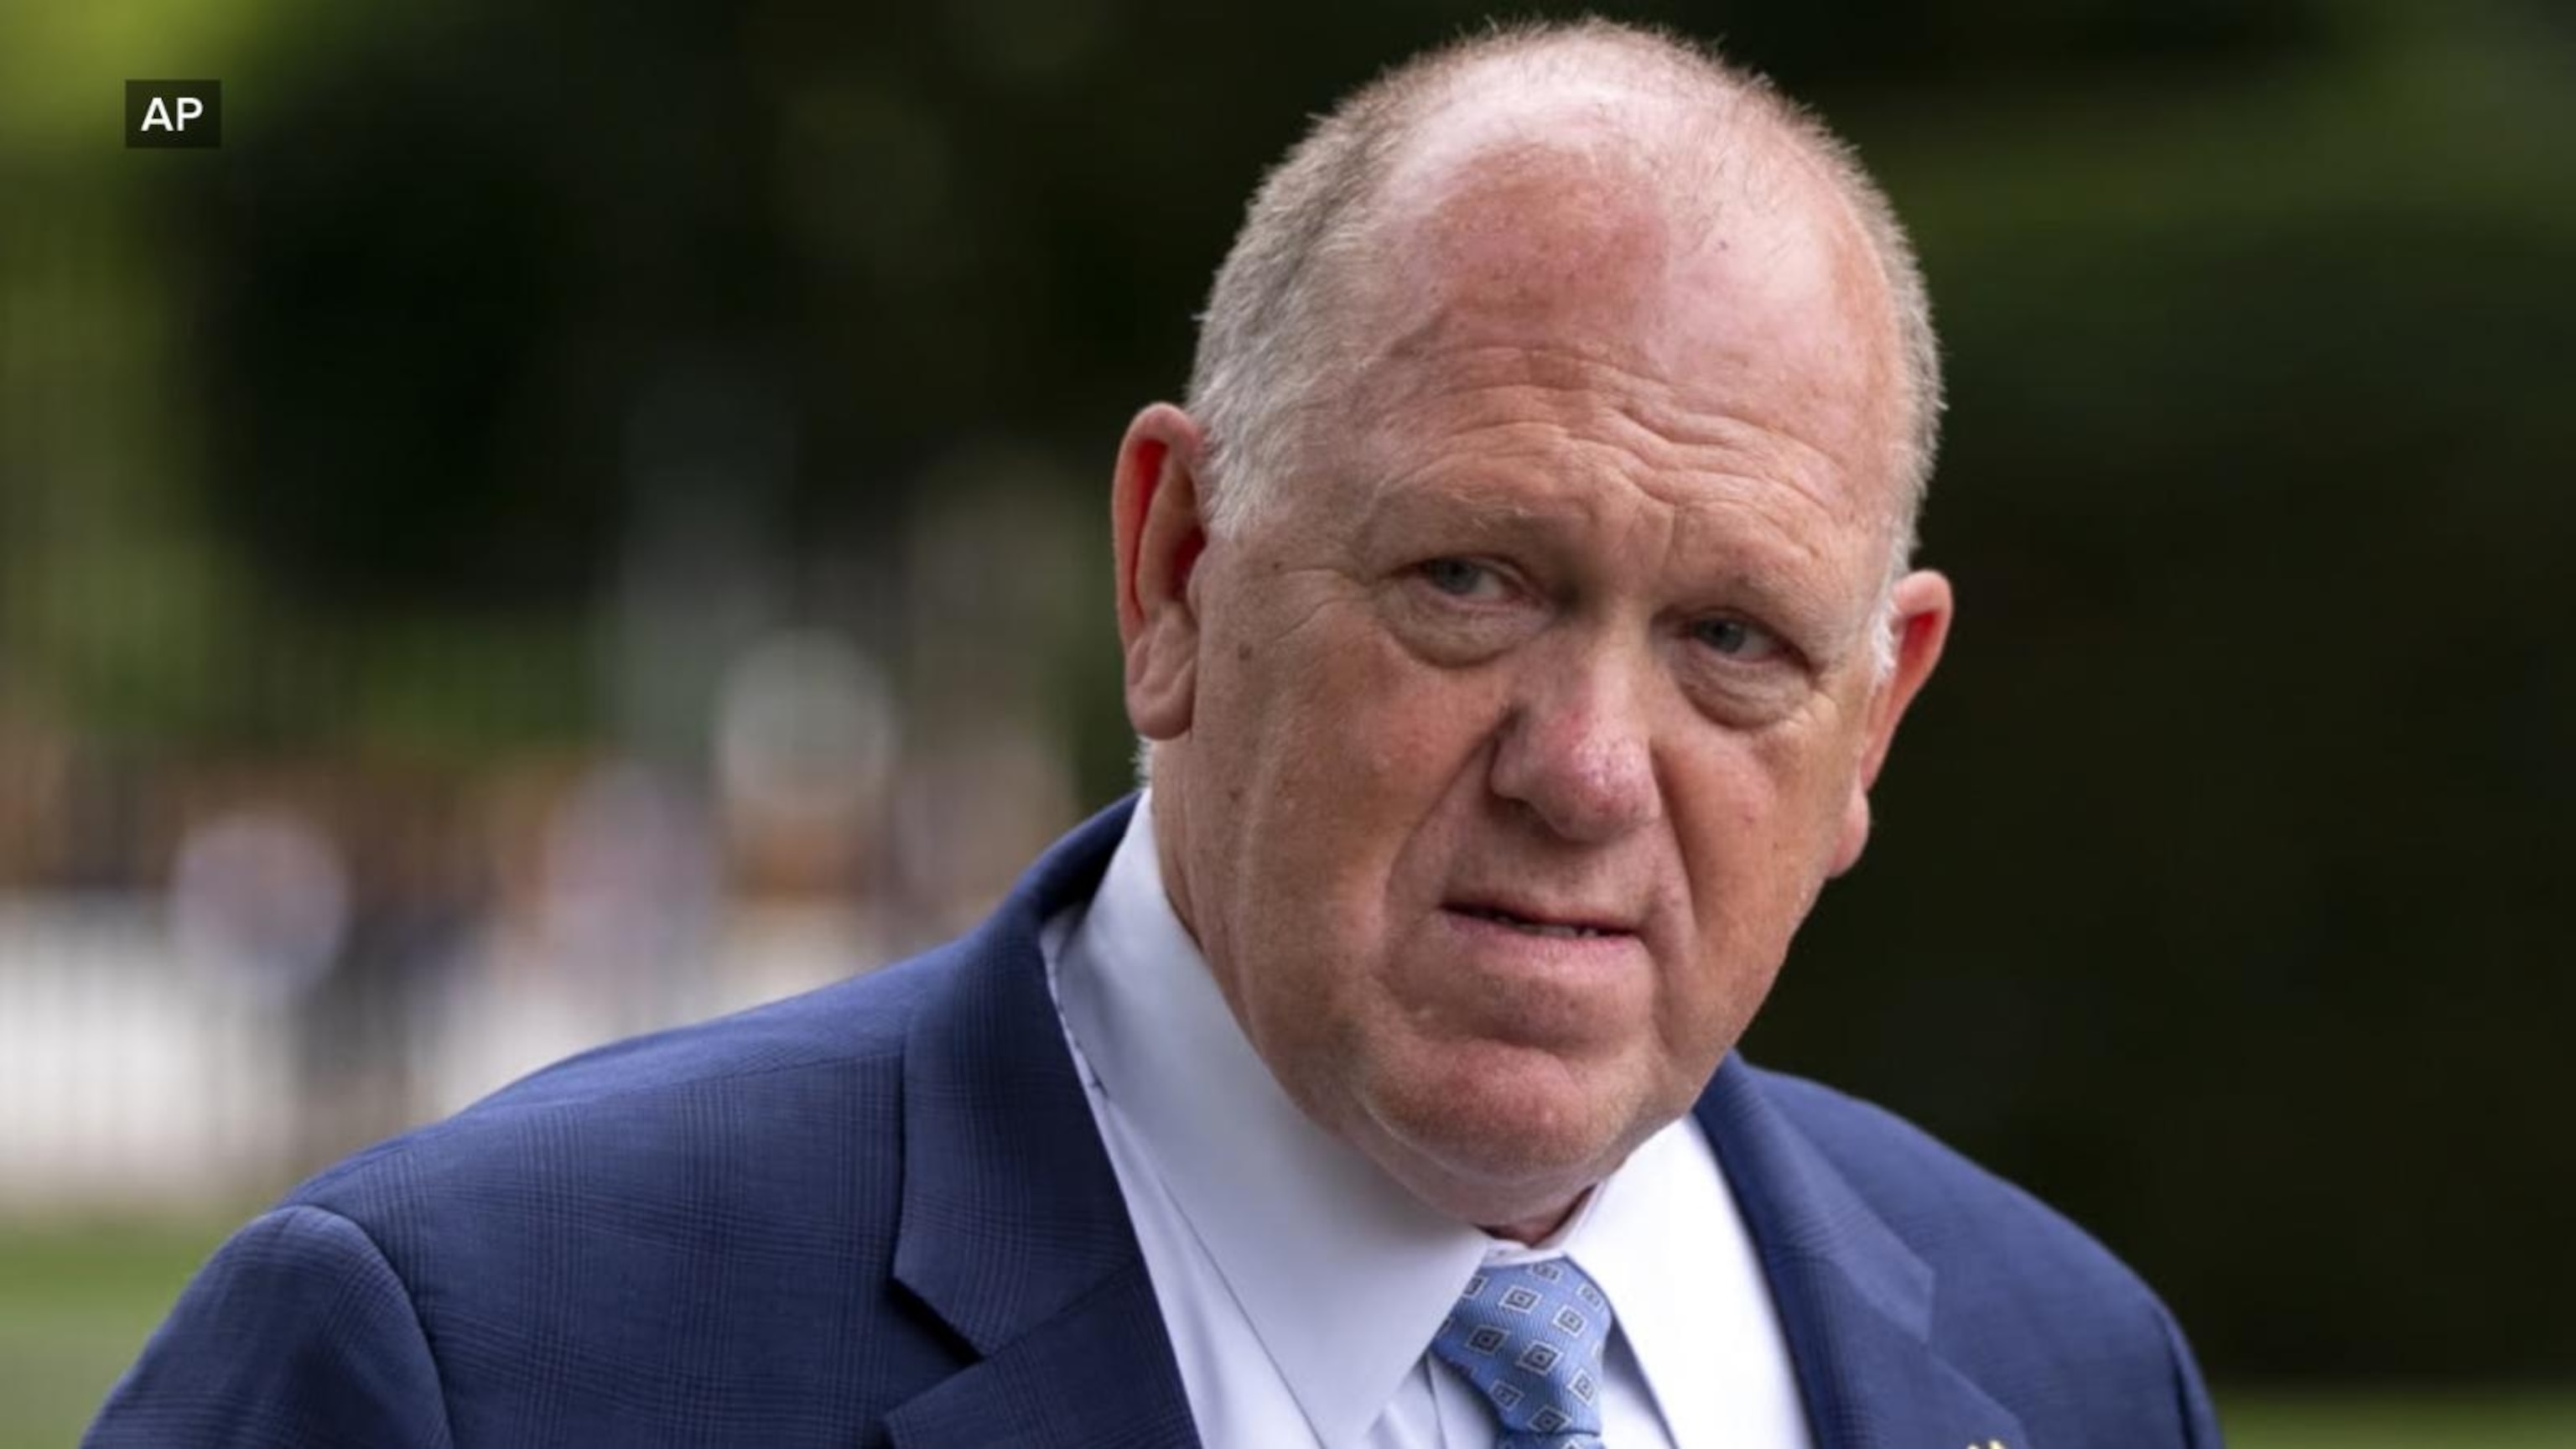
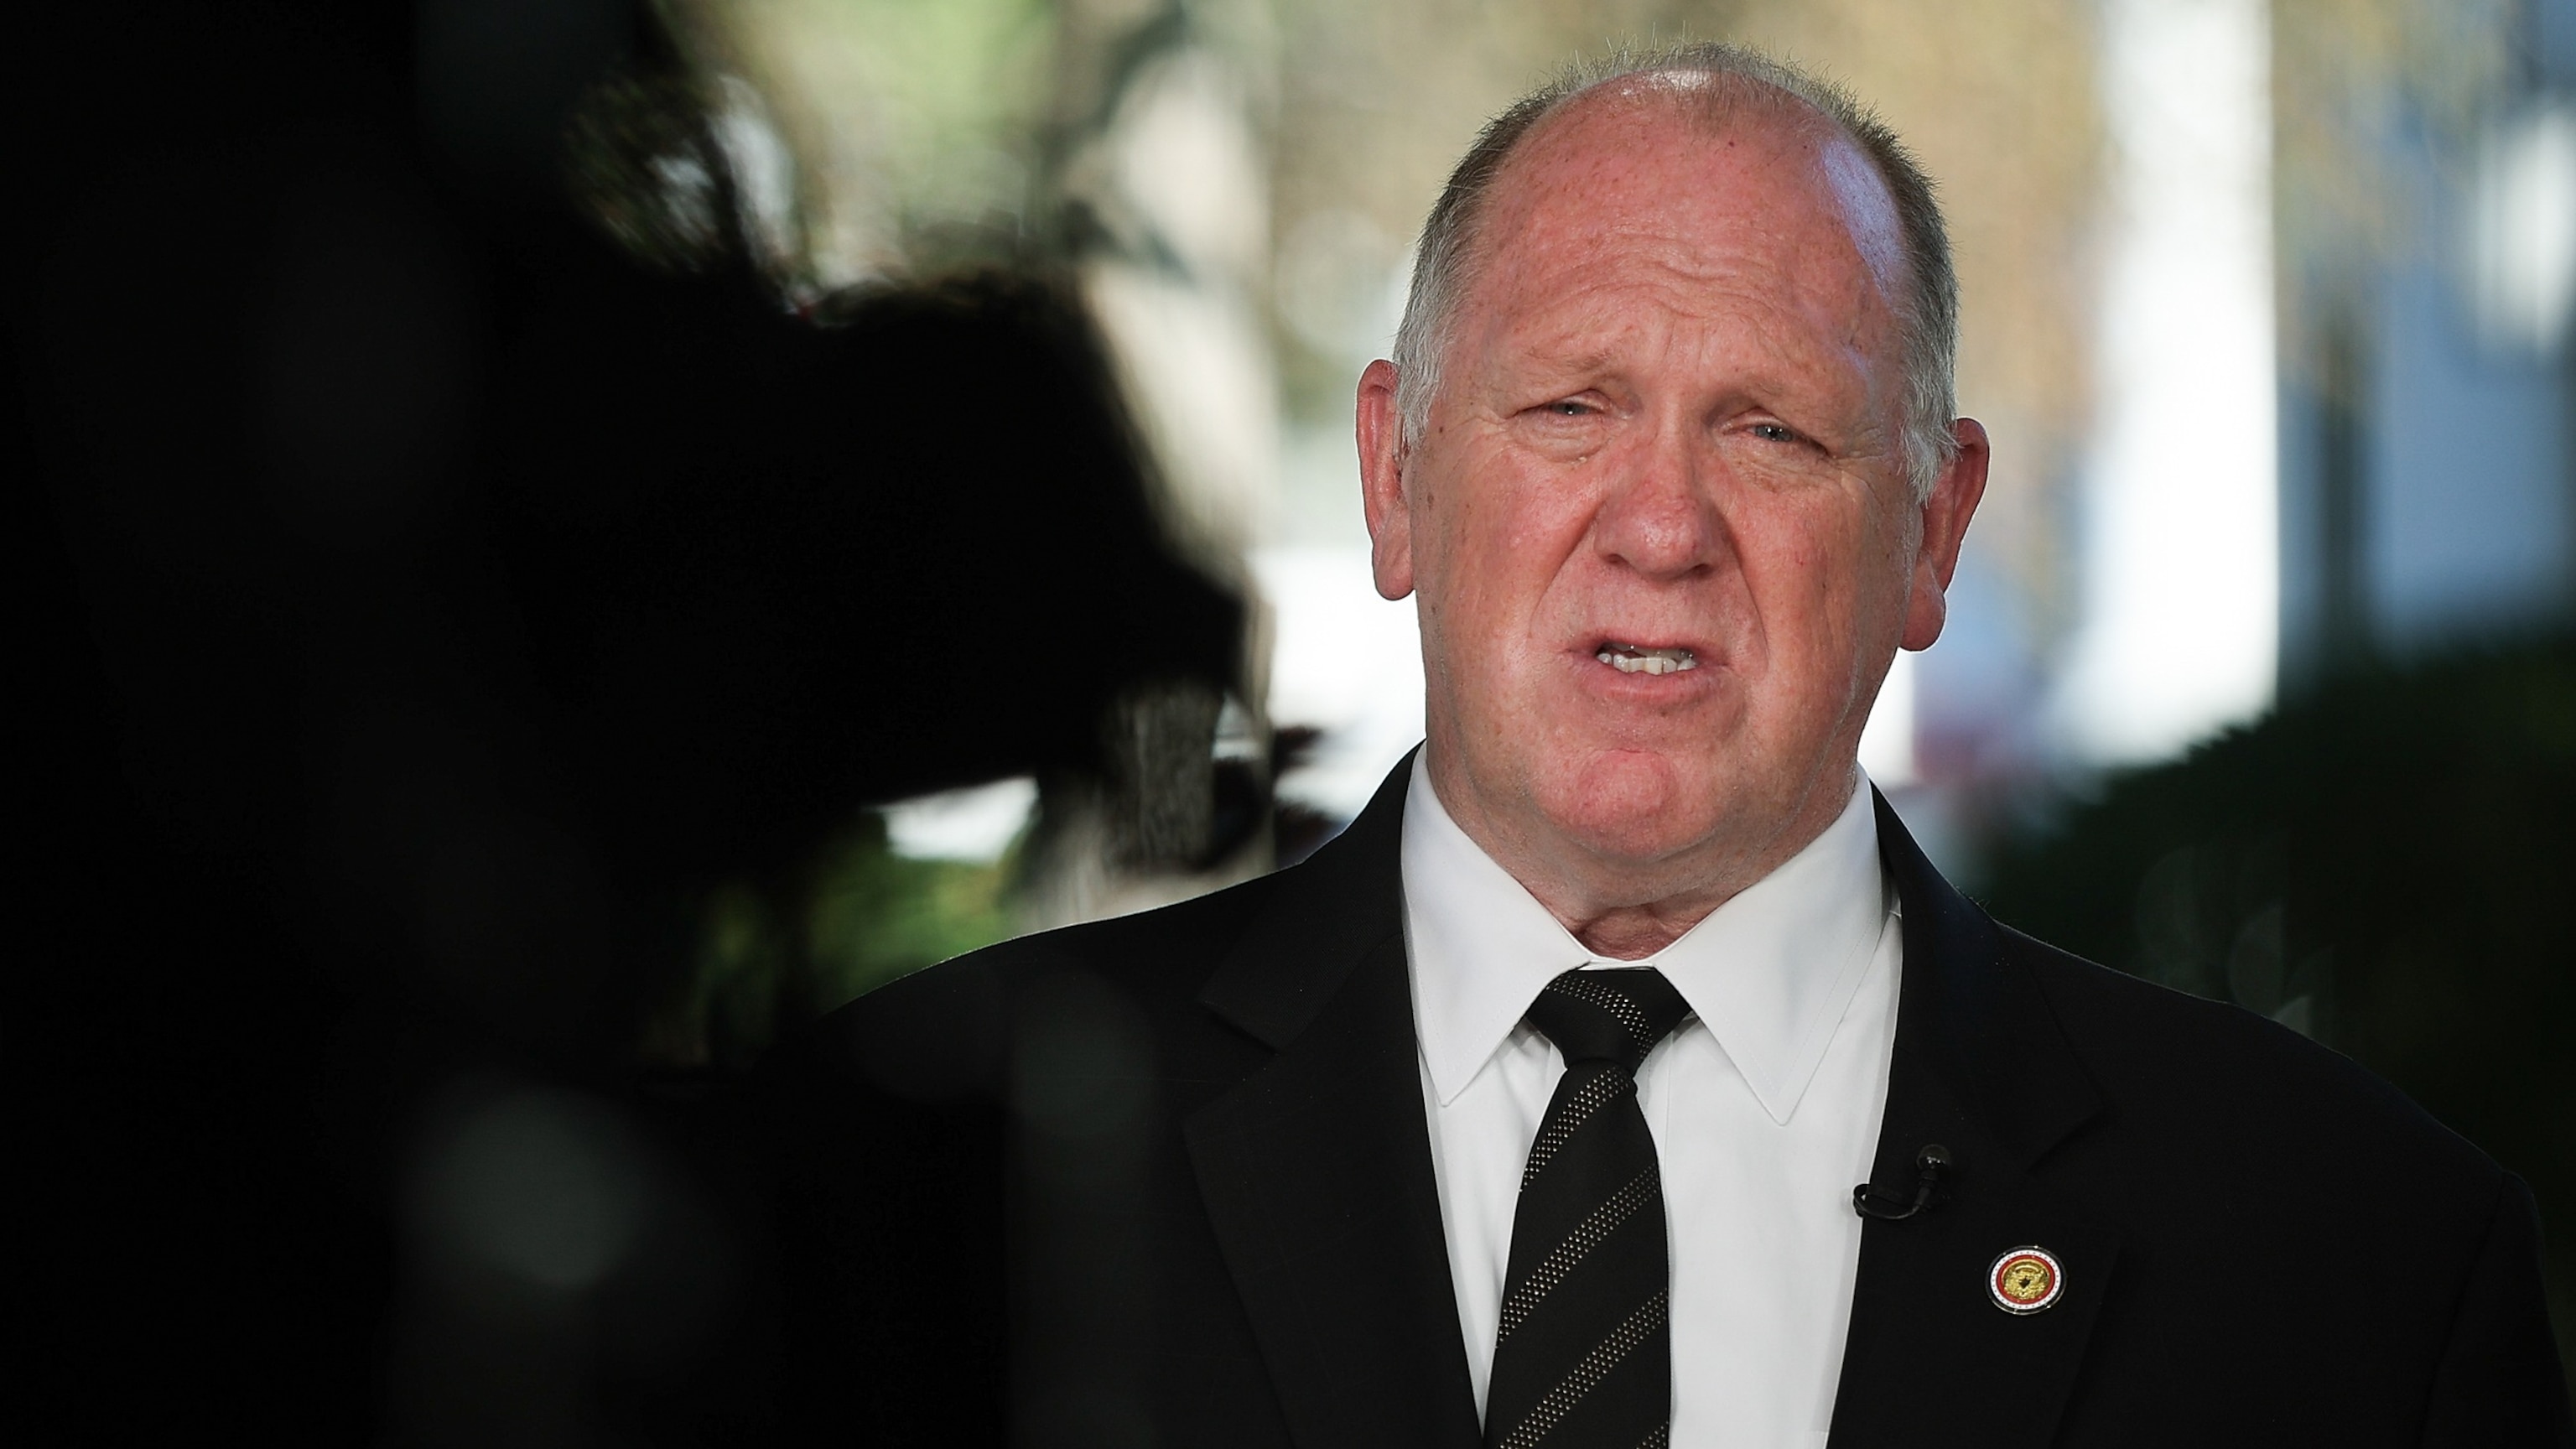
DOJ shut down probe involving Tom Homan: Sources
- 16 hours ago
5:12
Democrats blast Trump's call to have AG prosecute his enemies
- 17 hours ago
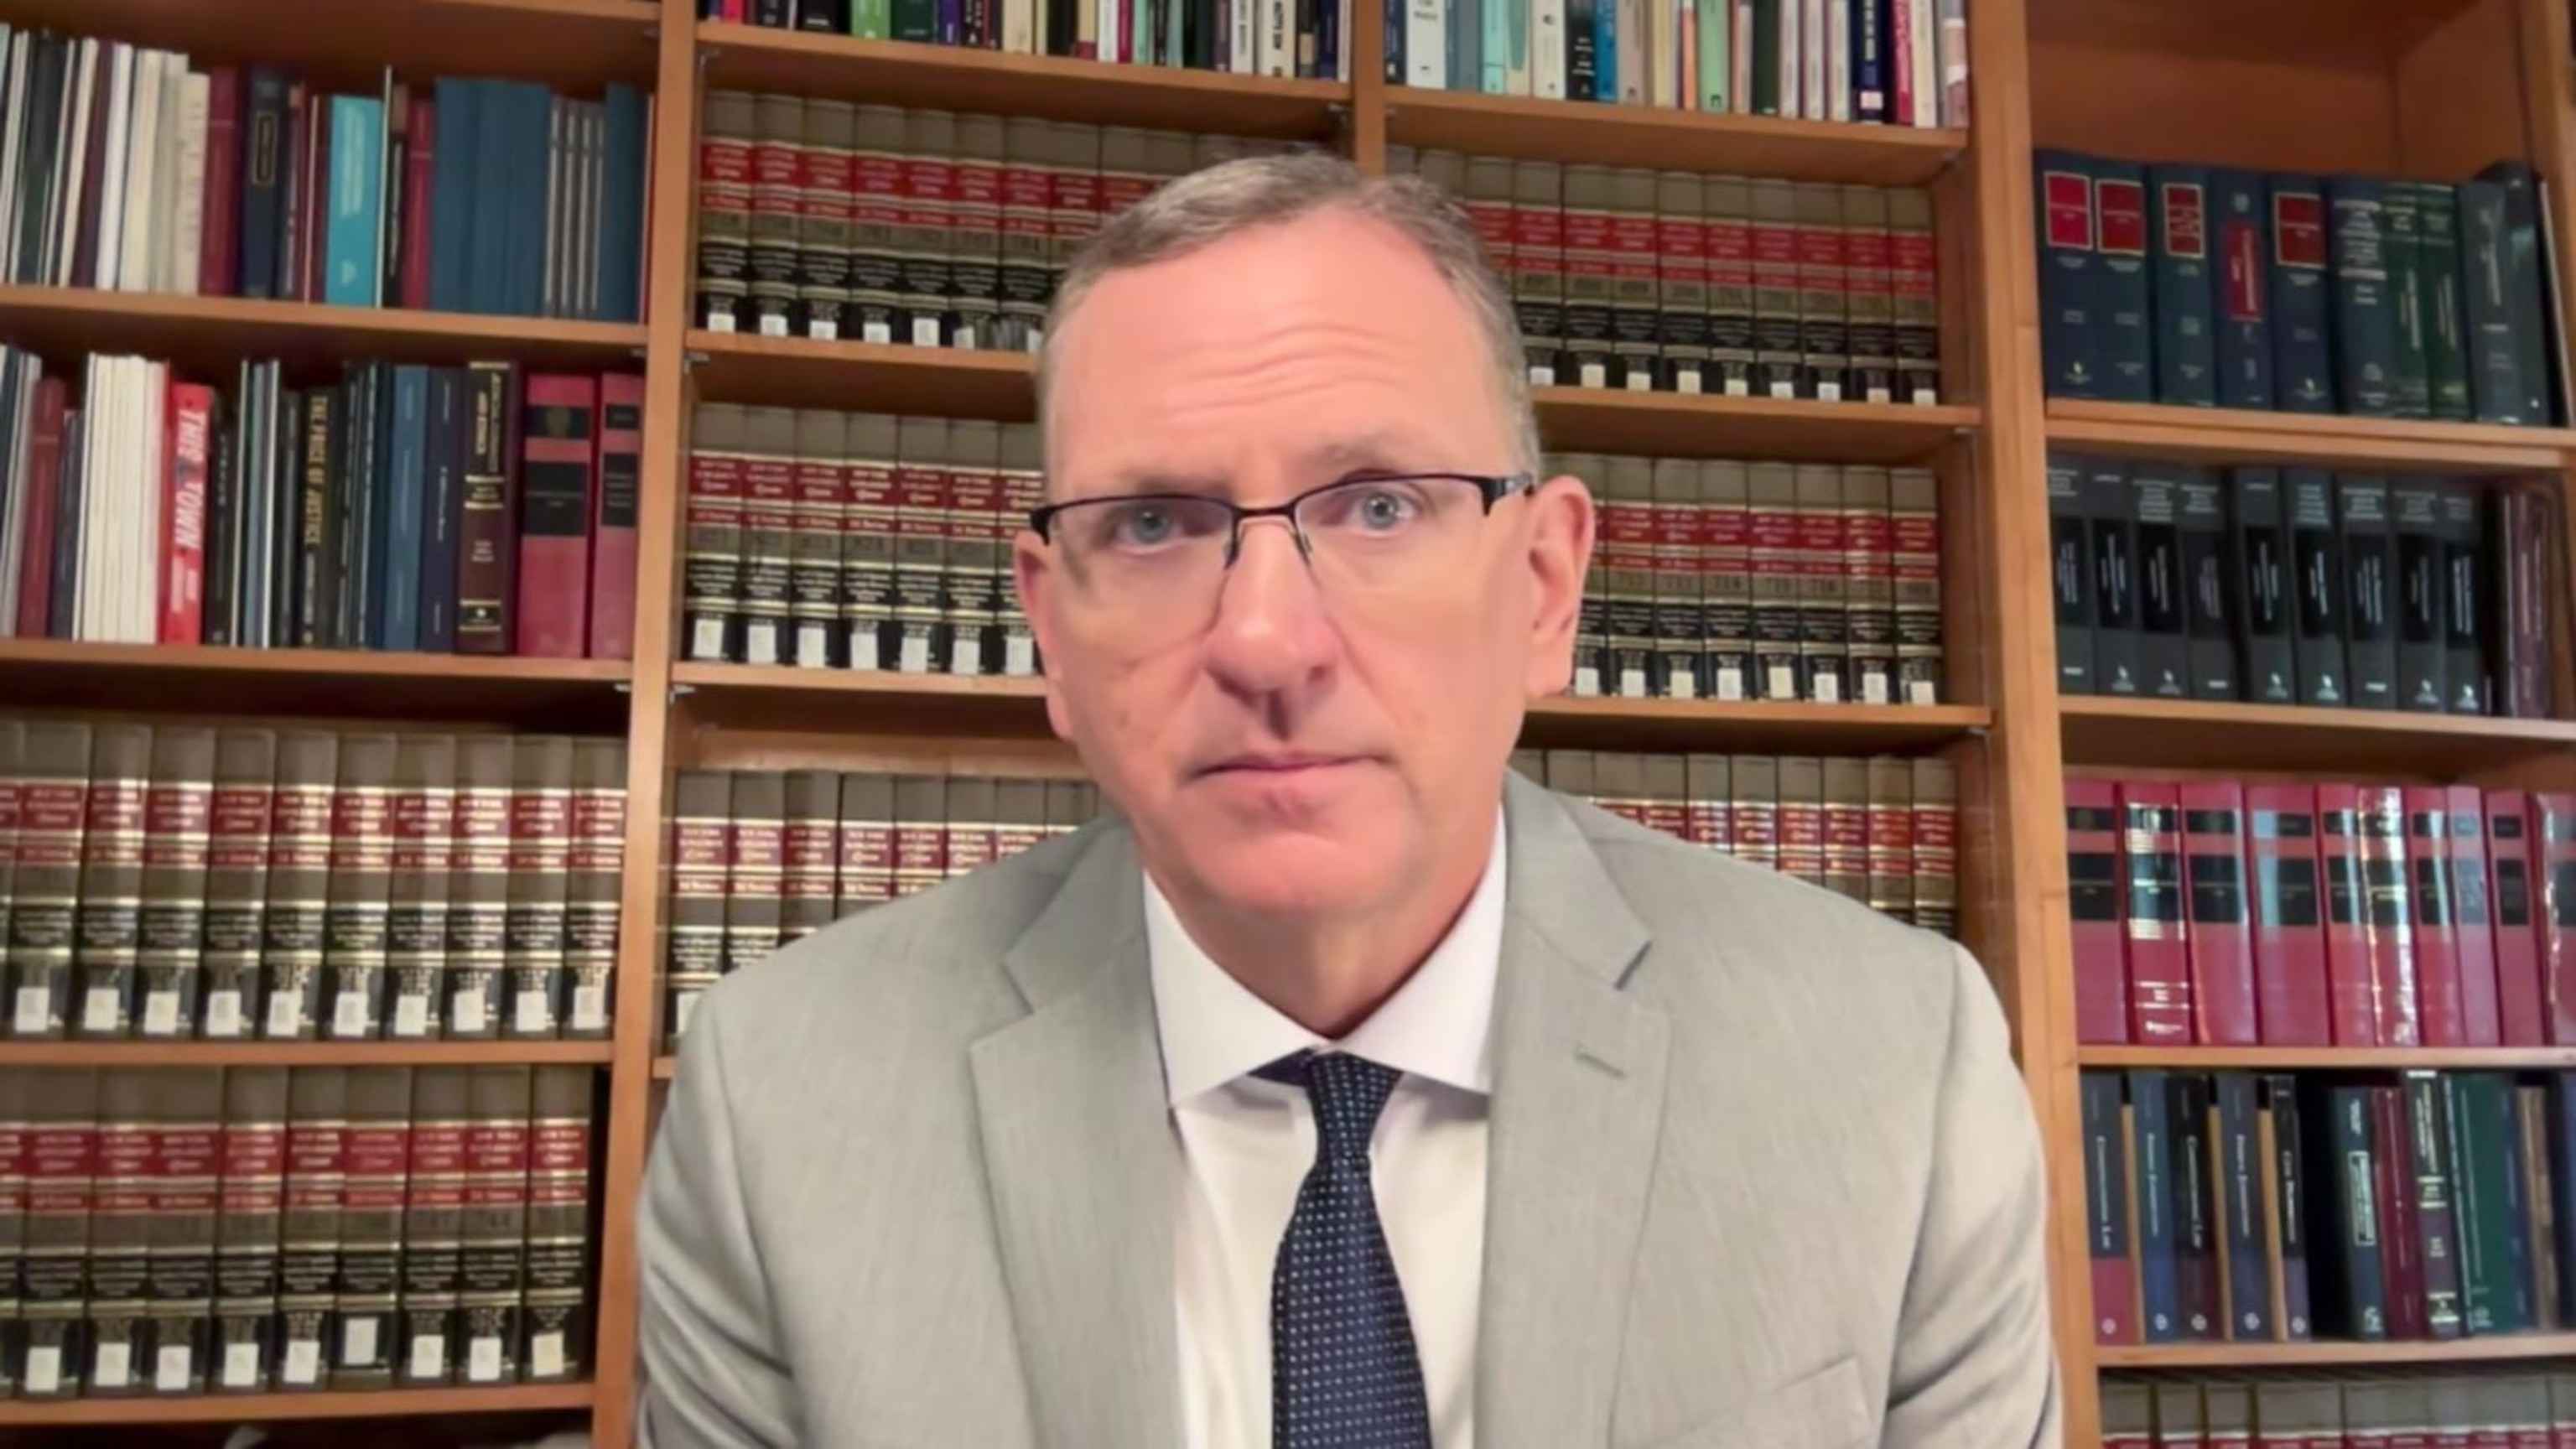
5:07
What Trump's call to prosecute enemies means for the justice system
- 18 hours ago
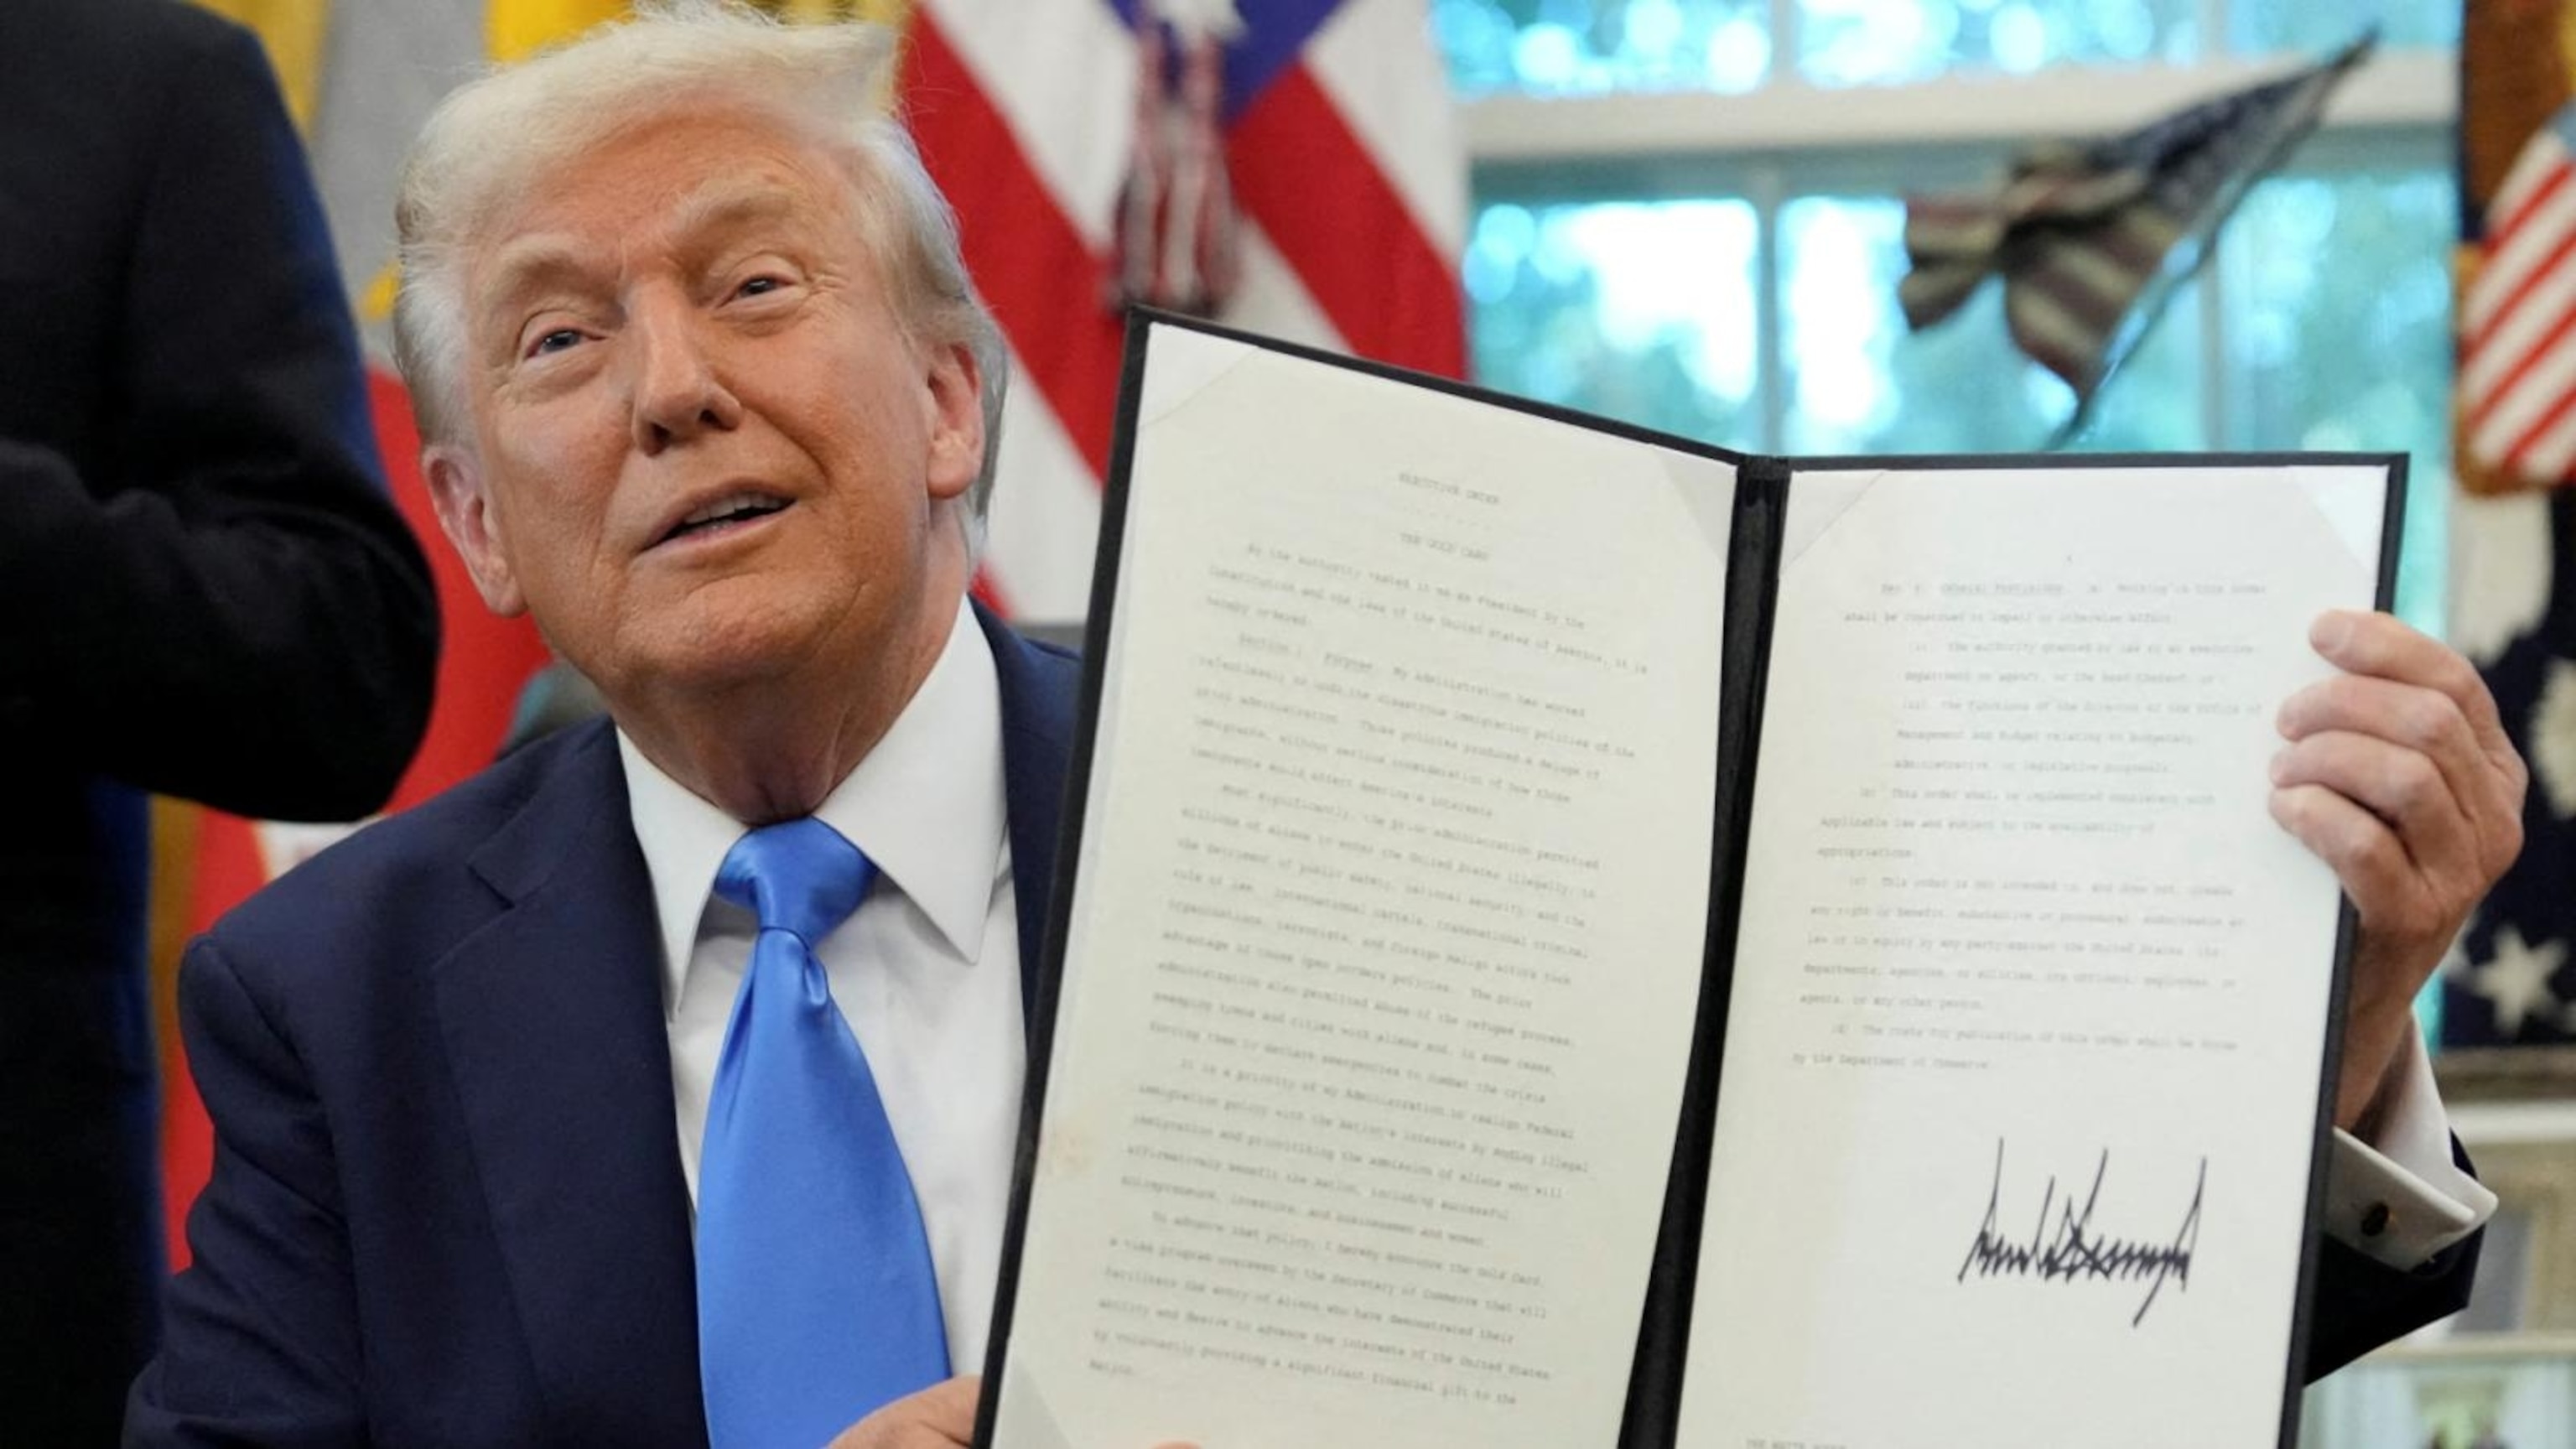
2:12
Trump imposes $100,000 fee on H1-B visas
- Sep 20
5:36
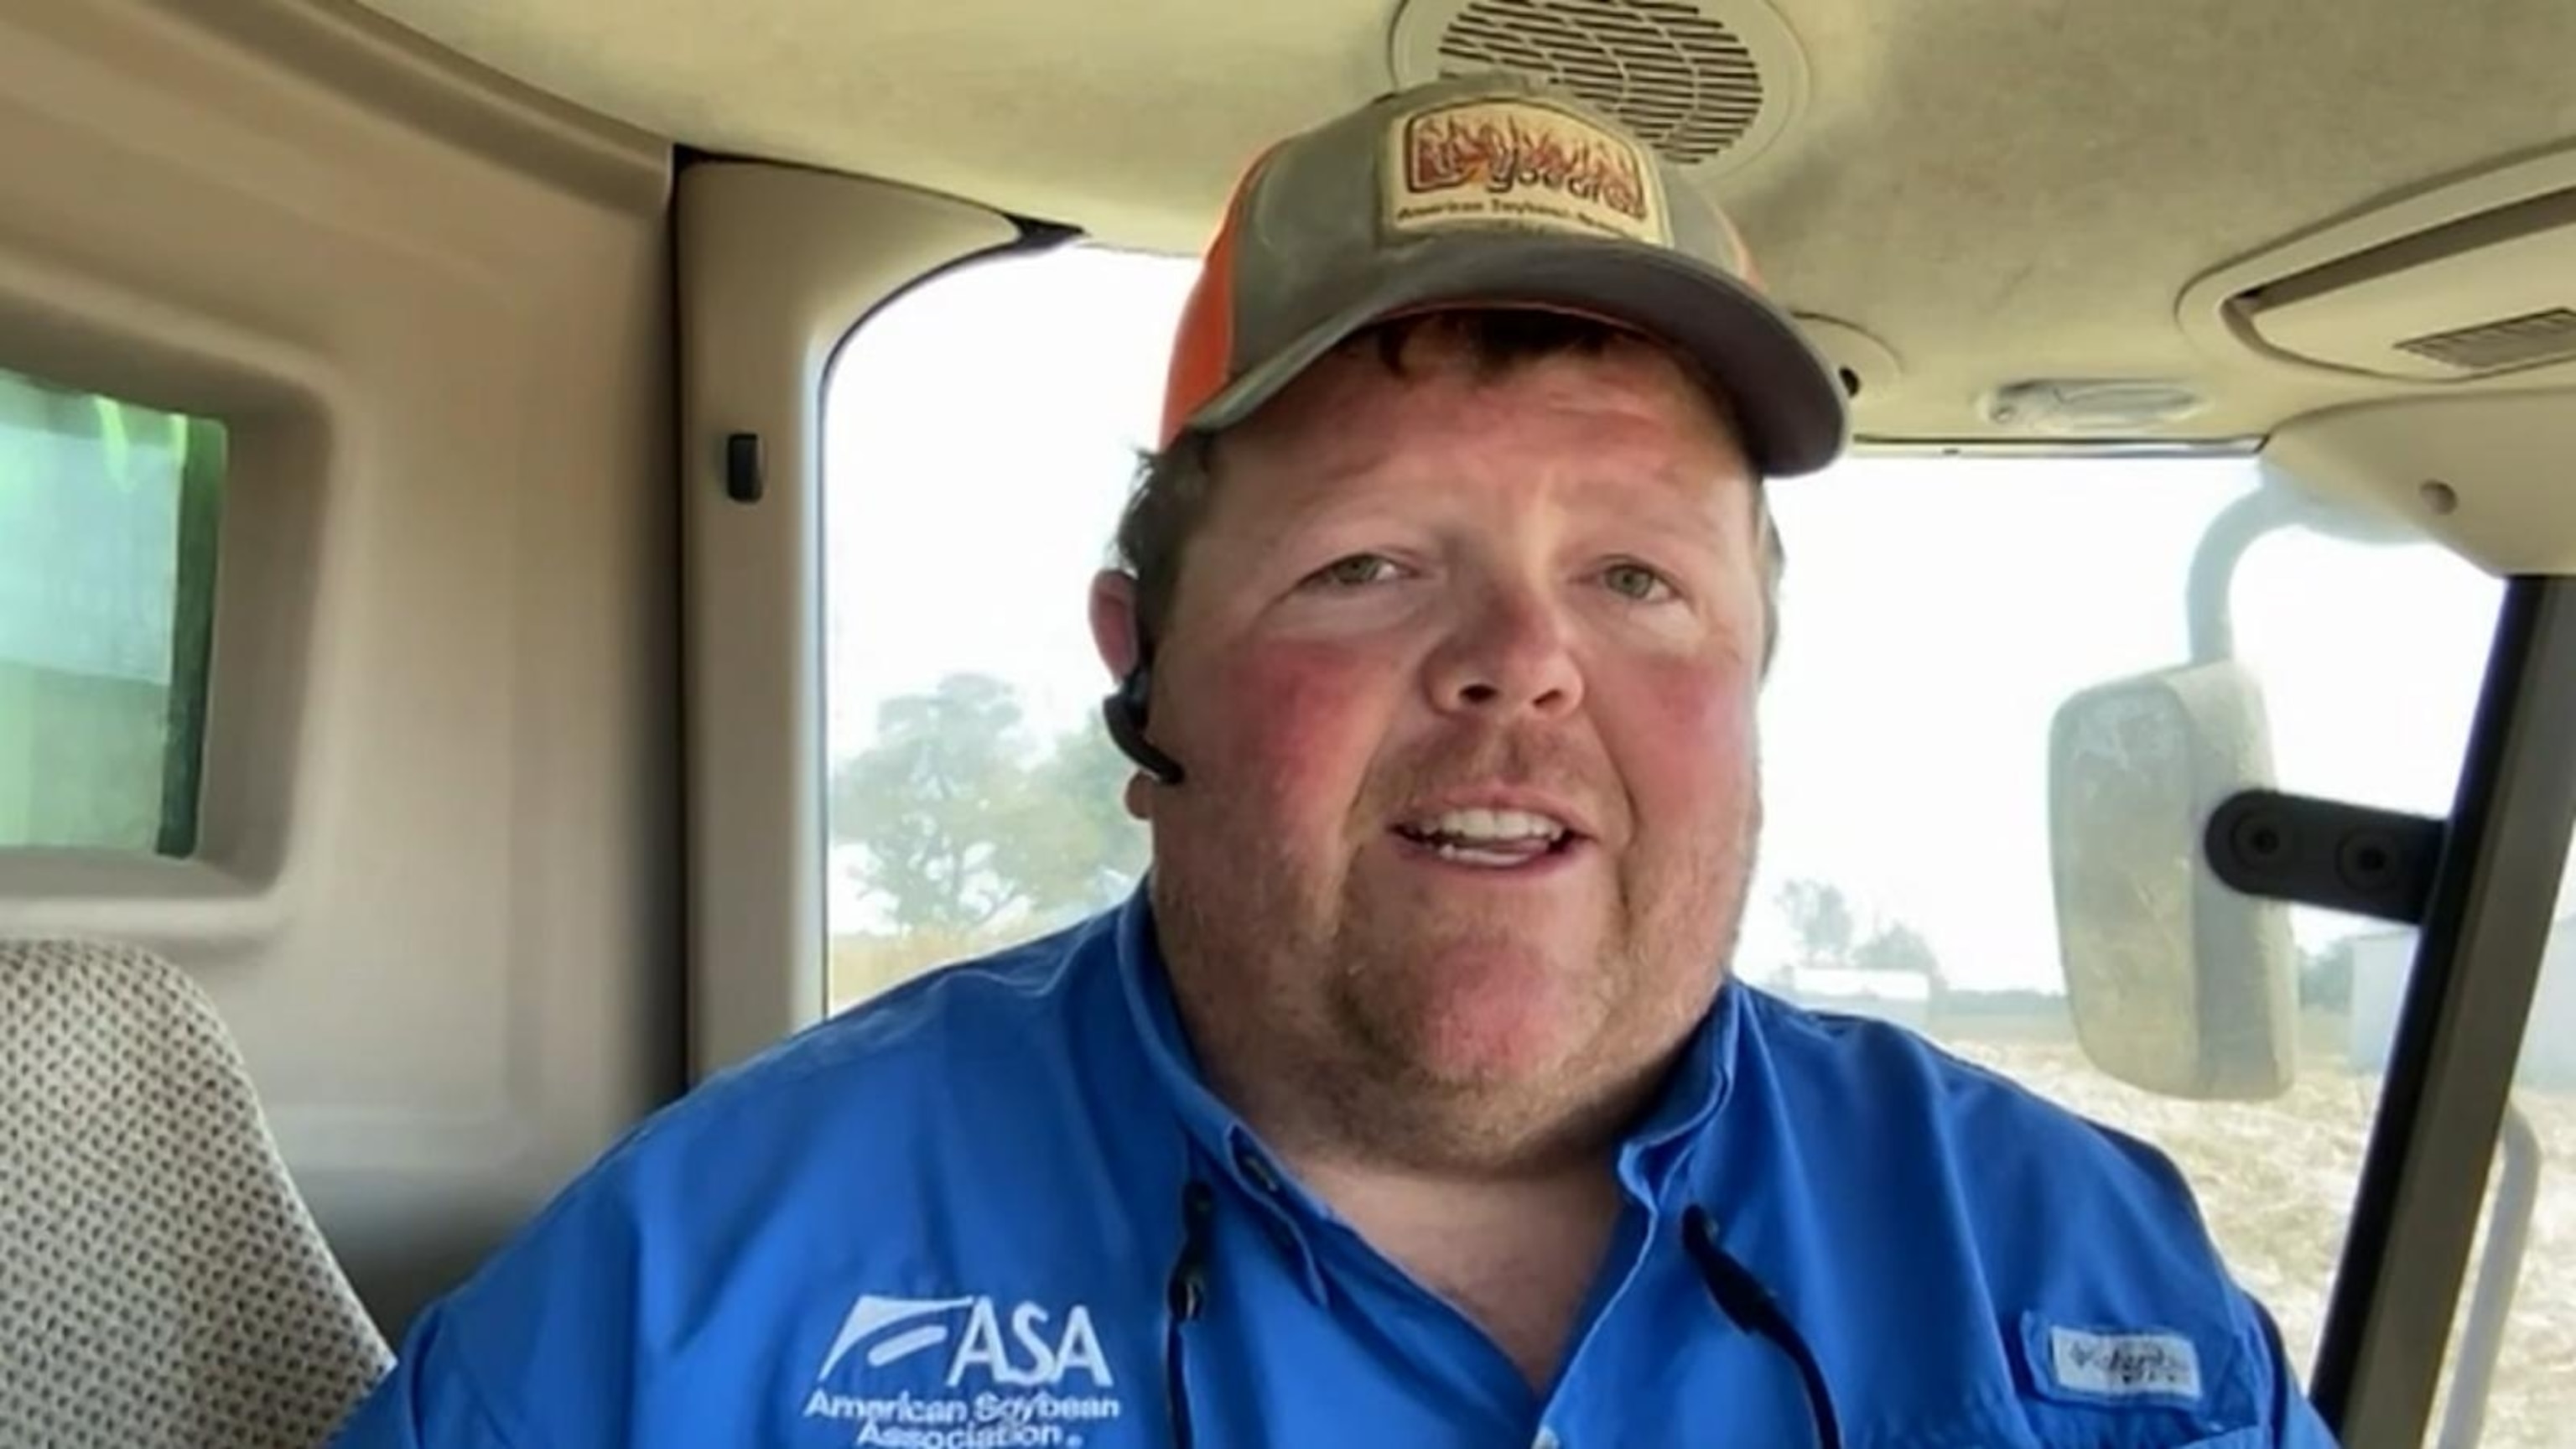
Soybean farmer to President Trump: 'We need actions now, not just words'
- Sep 19
1:20
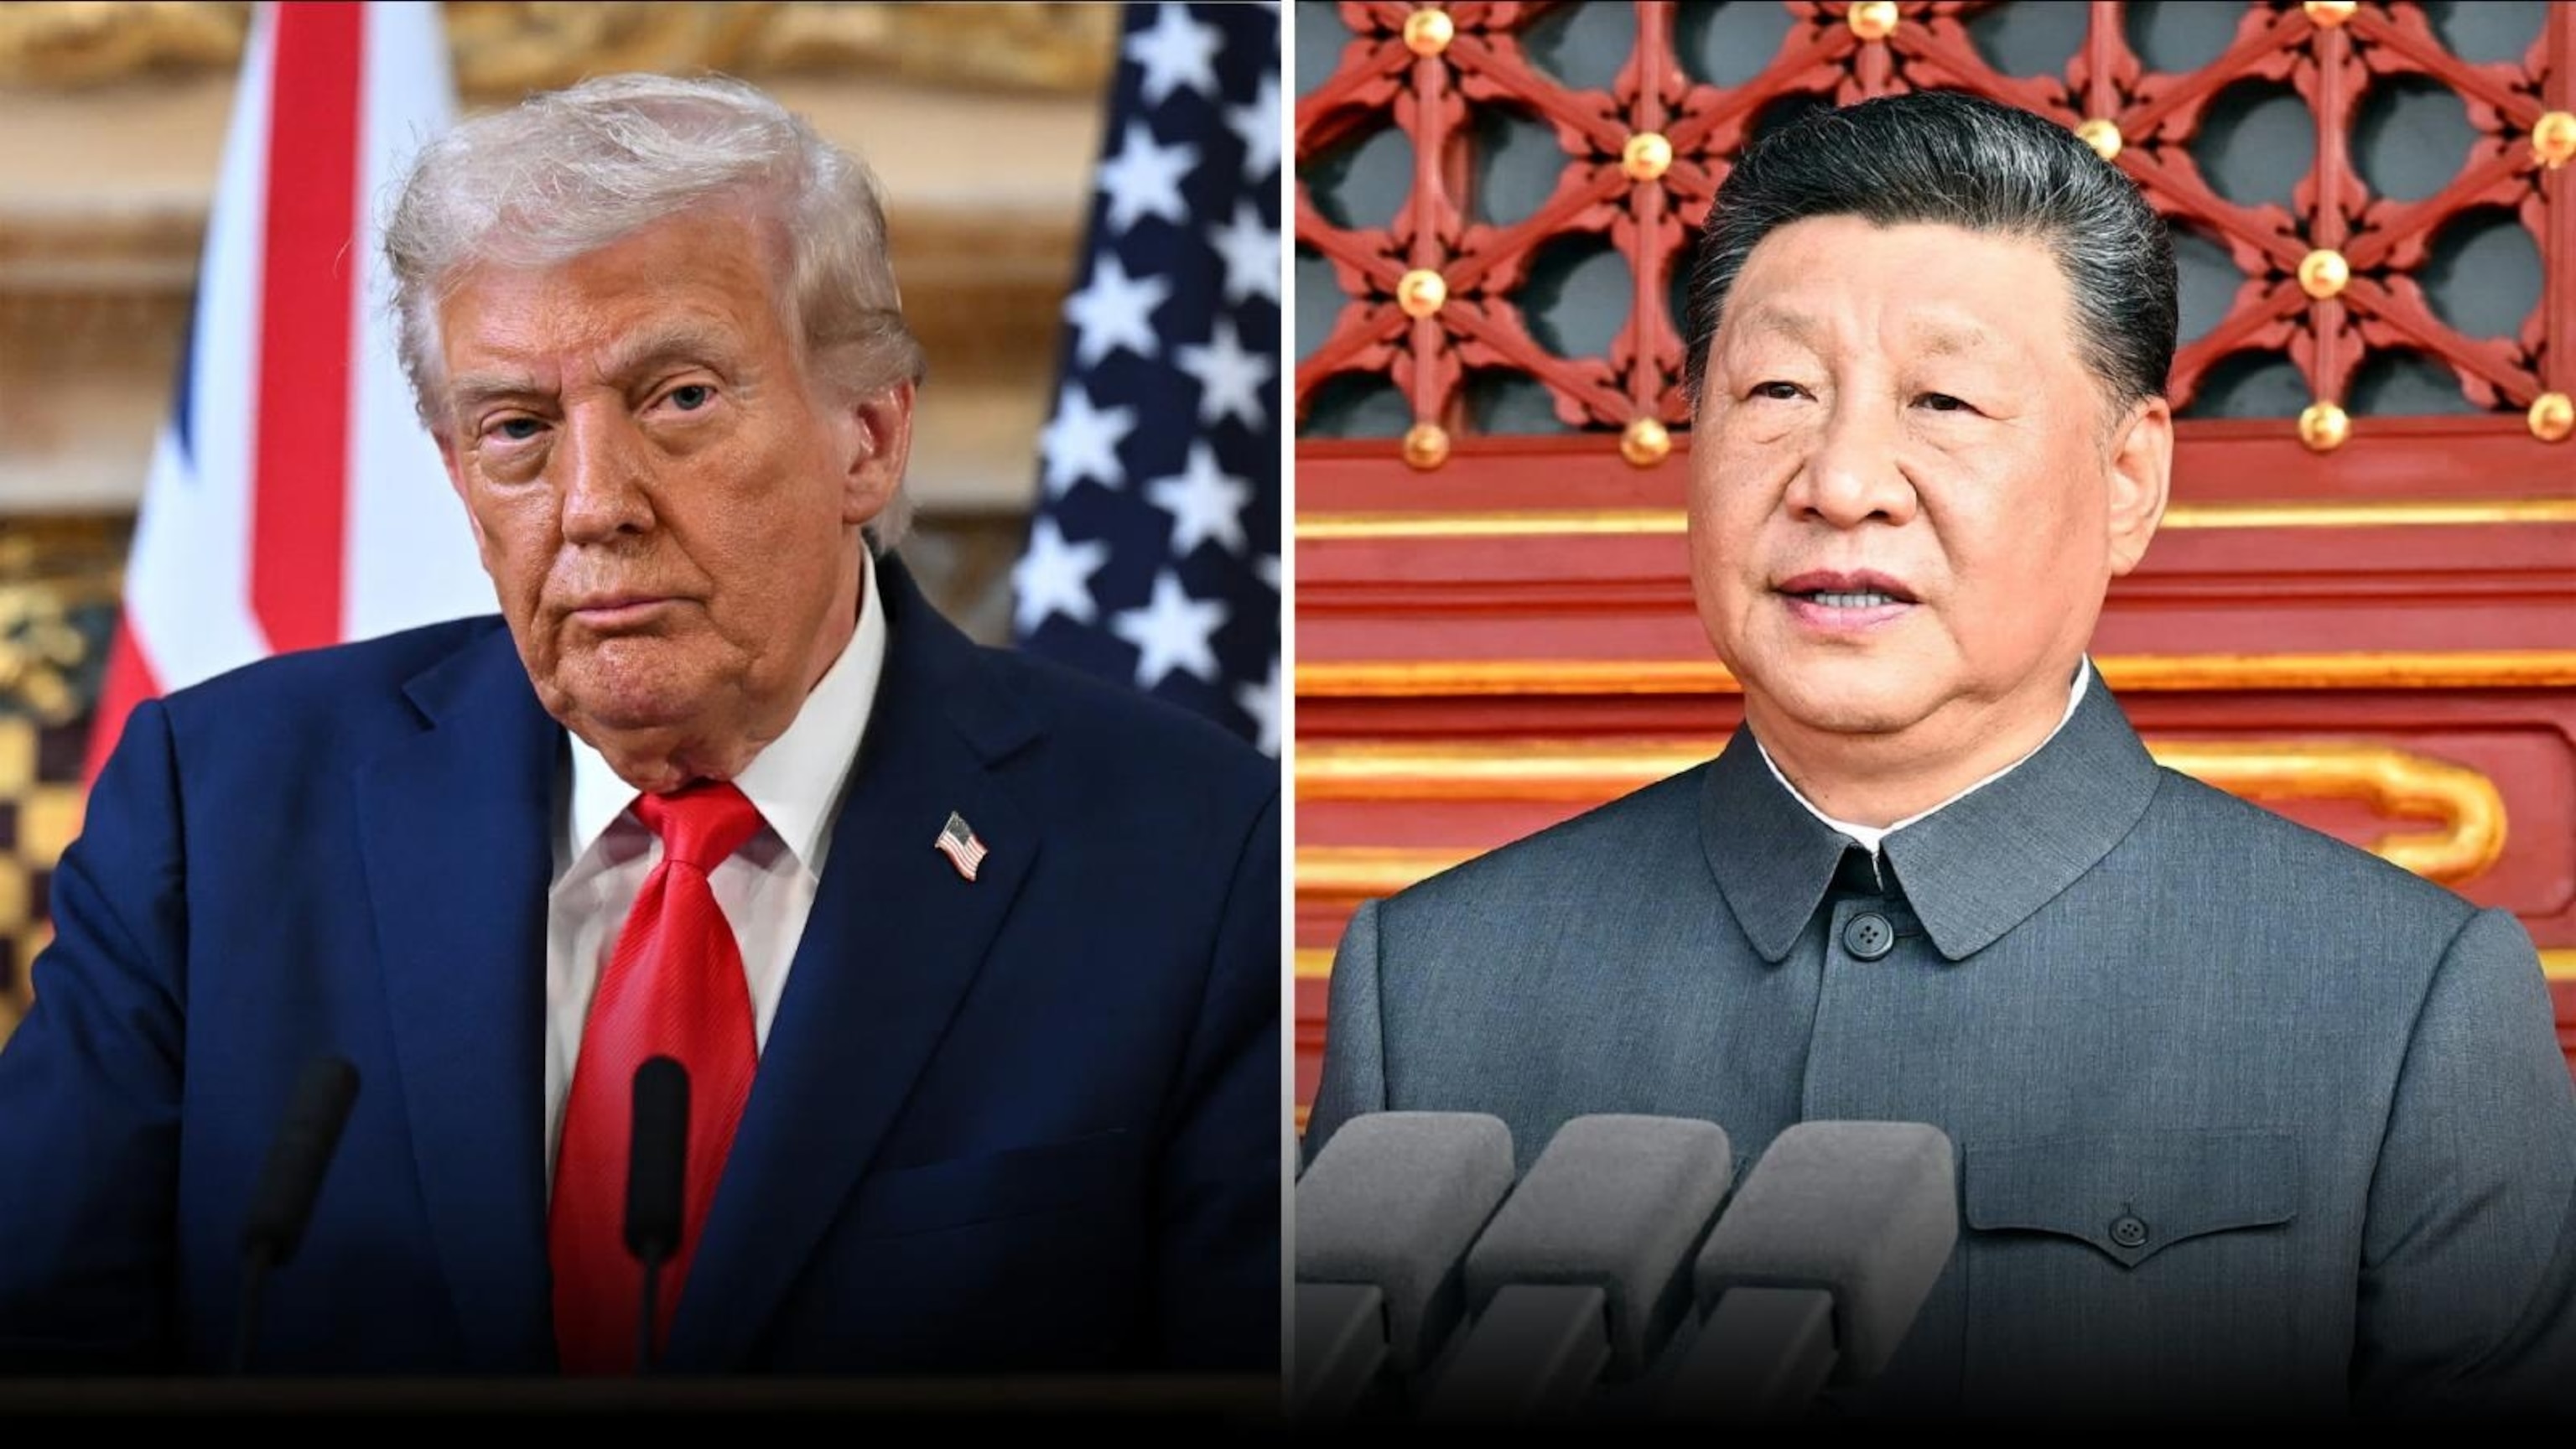
Trump says he will meet with Xi at APEC, travel to China in 2026
- Sep 19
0:51
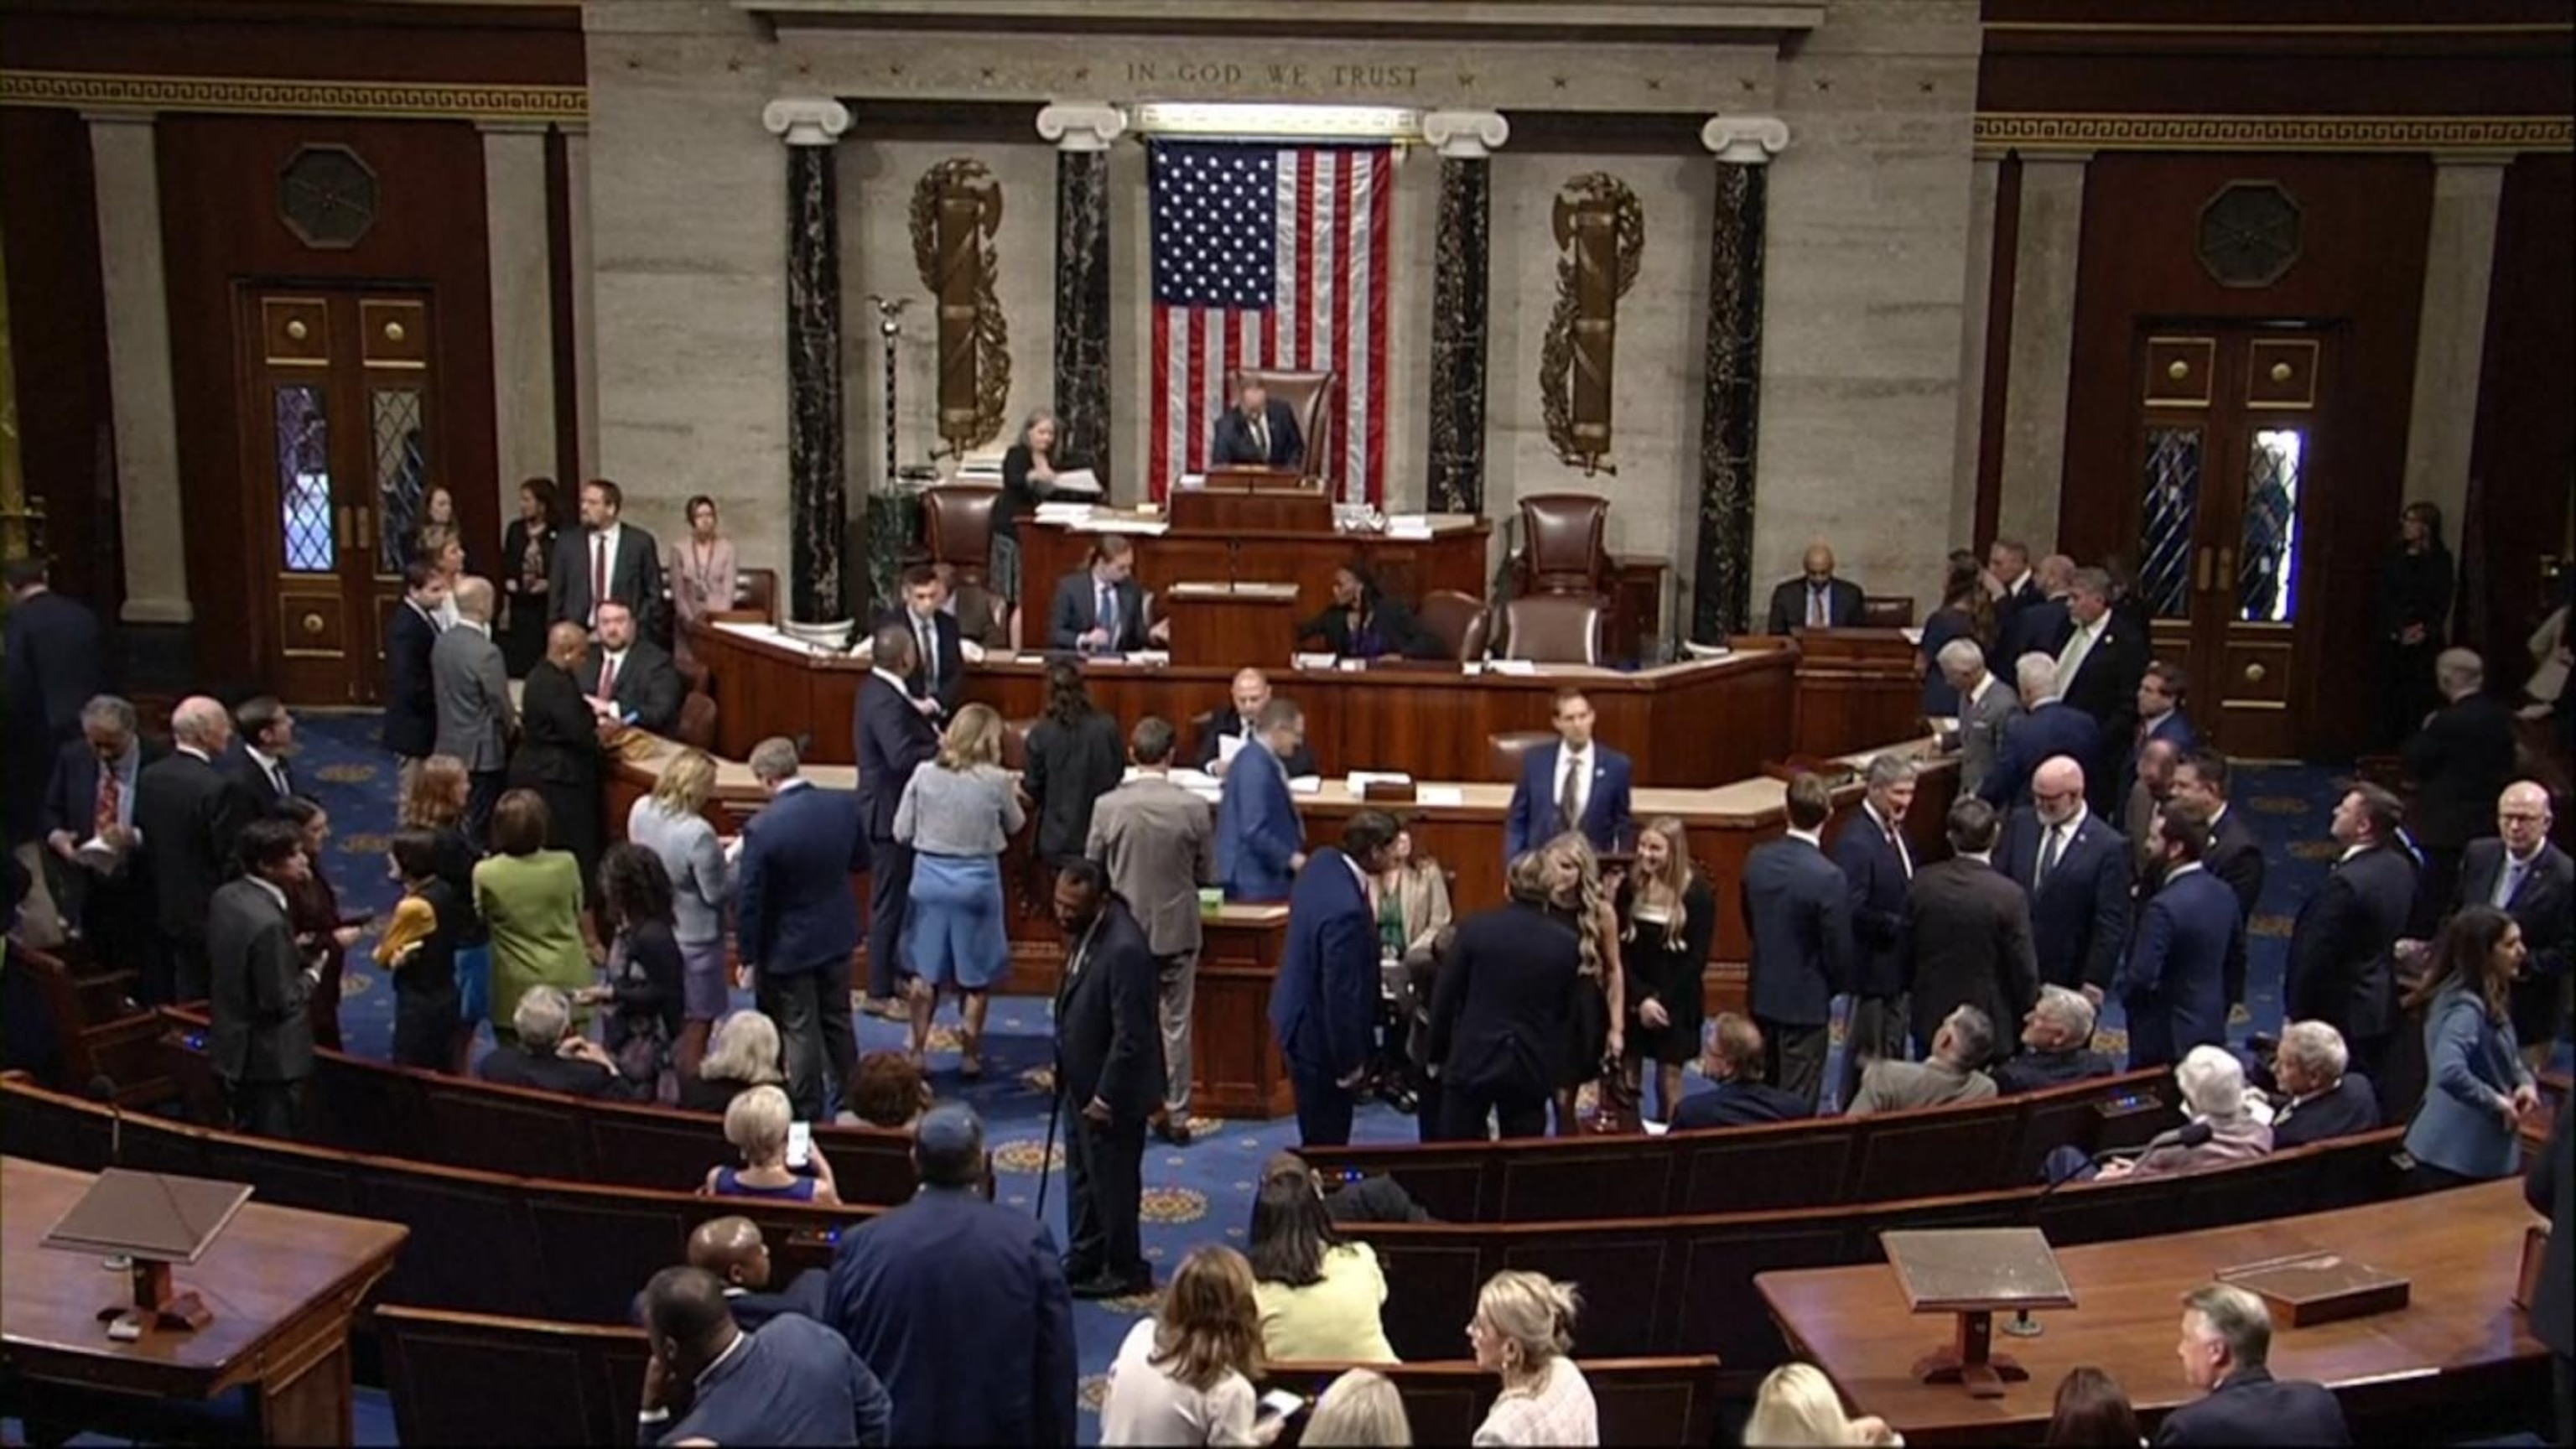
House passes Republicans' short-term government funding bill to avert shutdown
- Sep 19
2:02
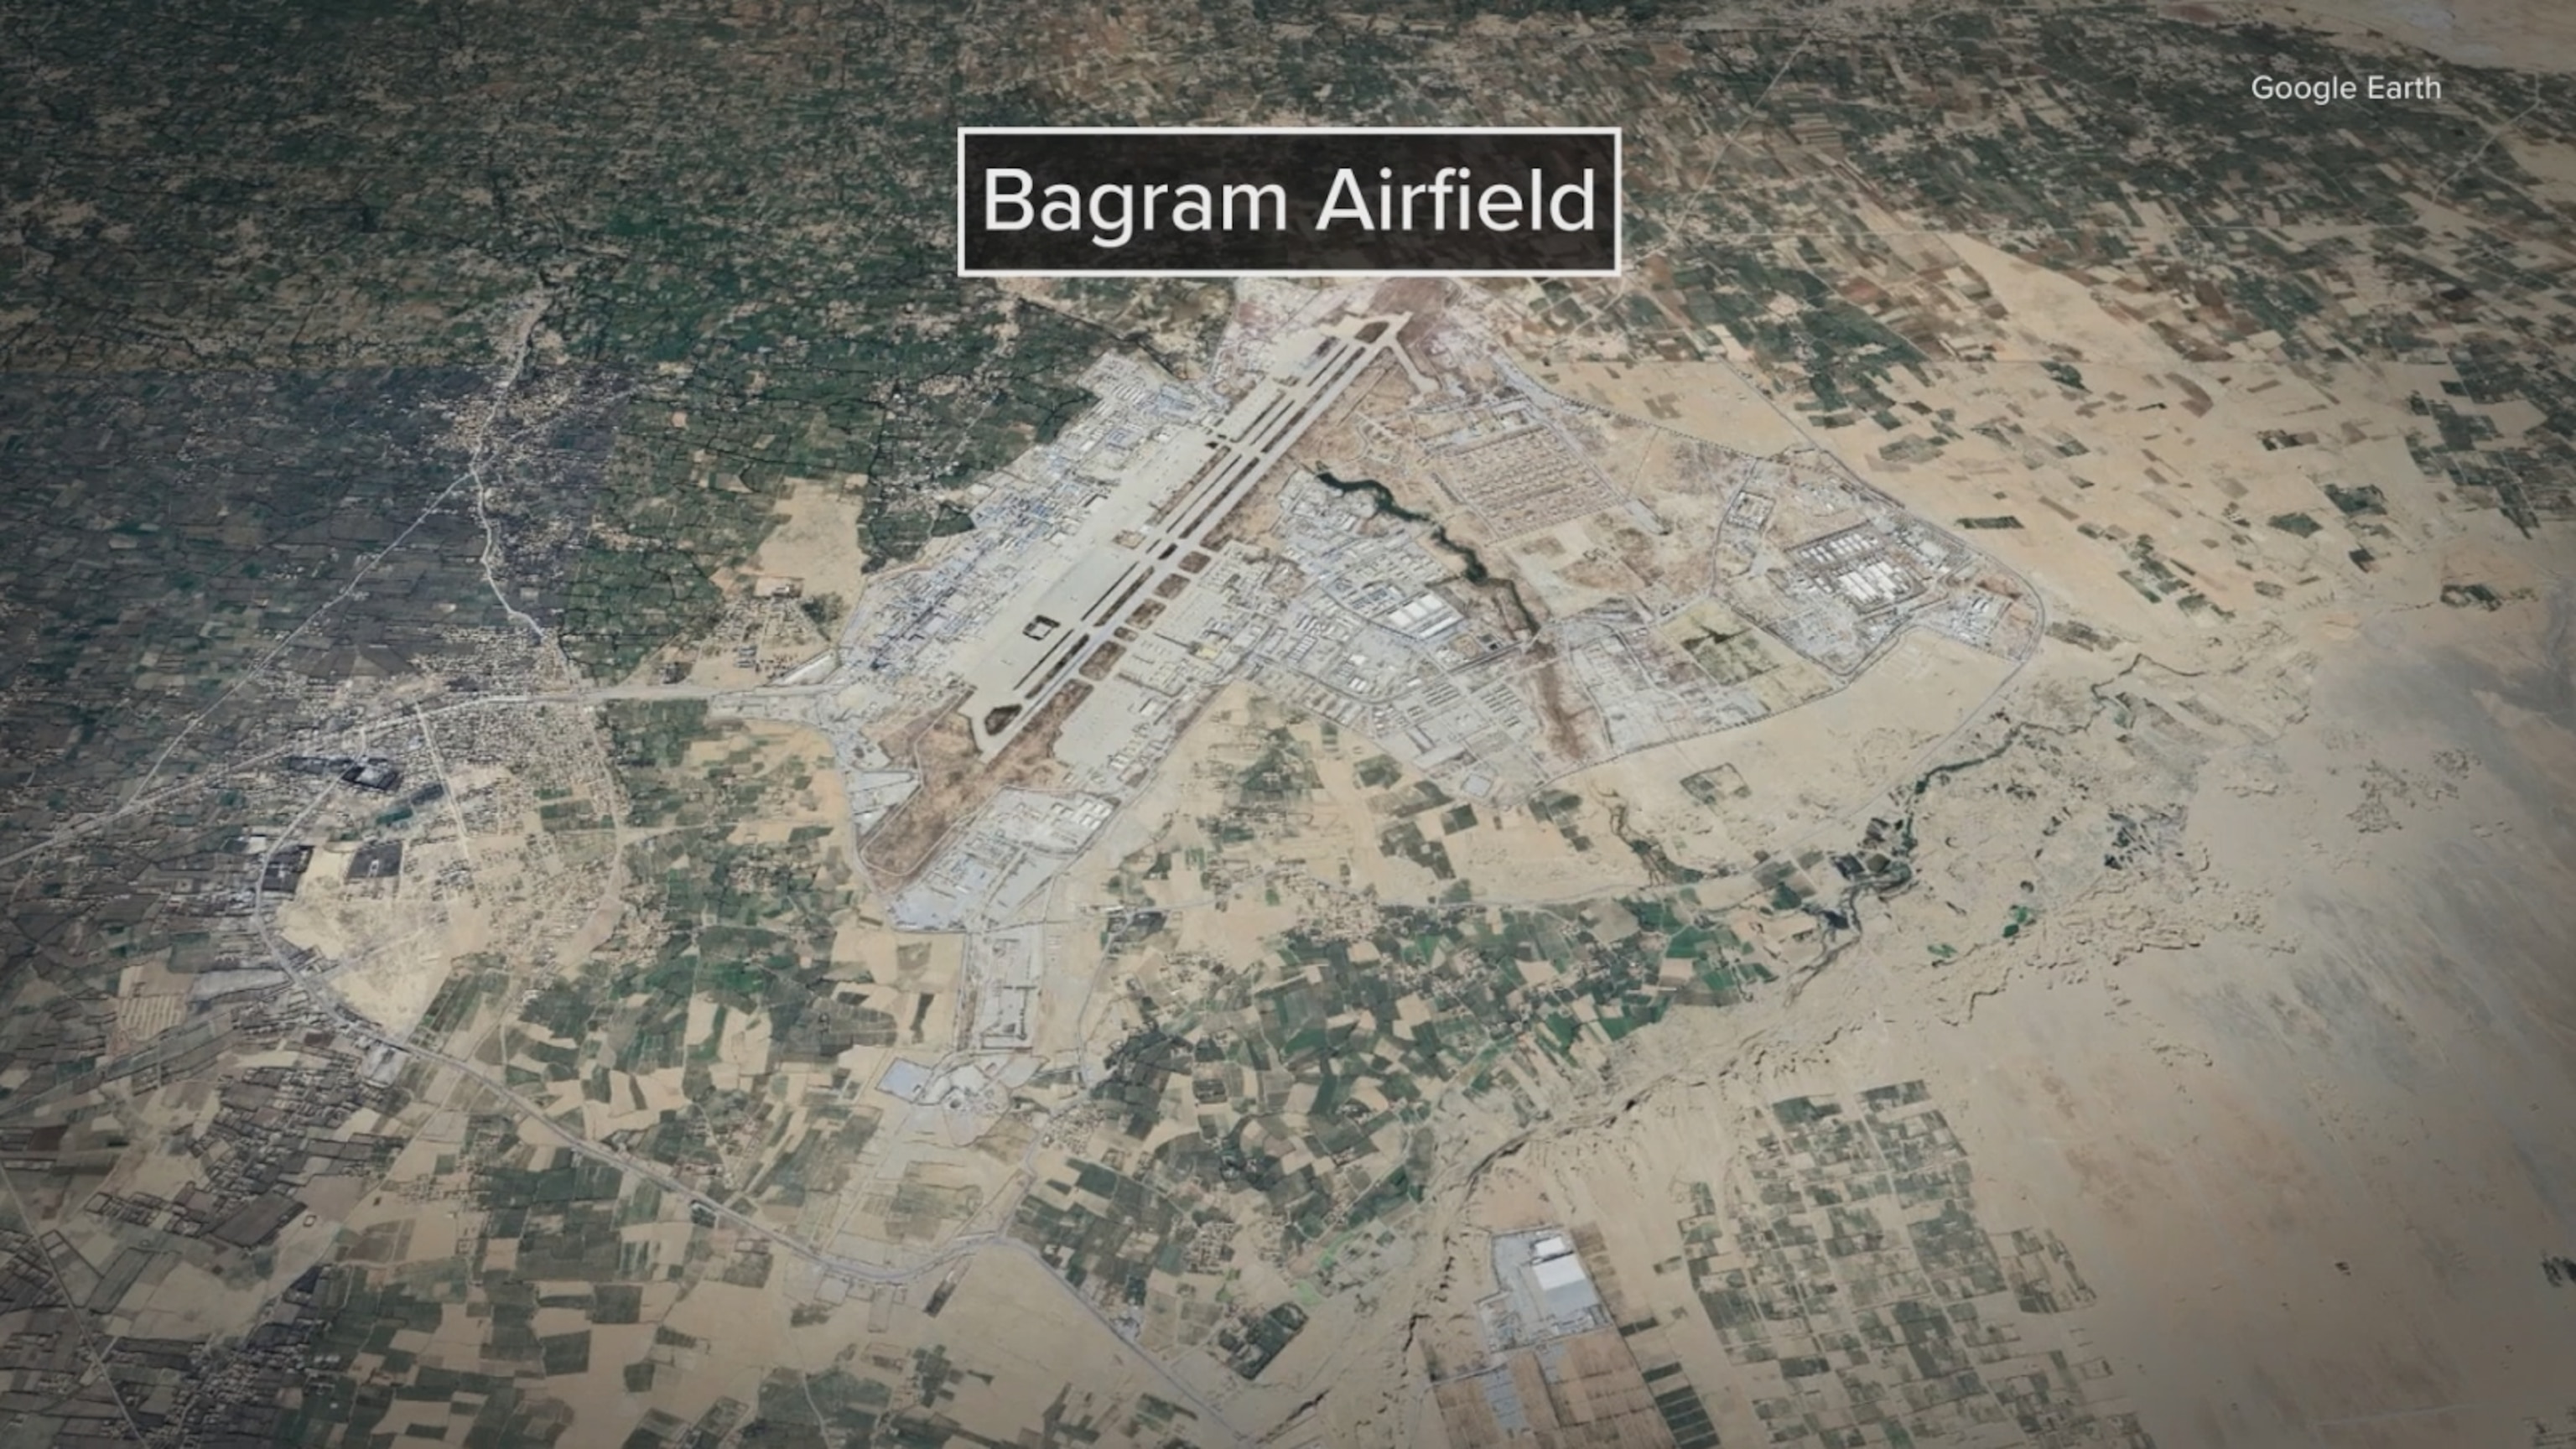
Trump says he's trying to get Afghanistan's Bagram Air Base 'back'
- Sep 18
Playlist · 10 Videos