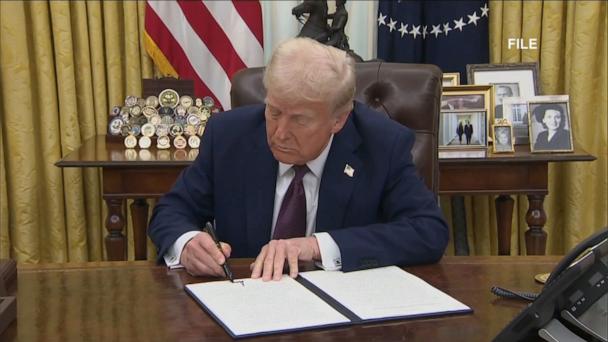
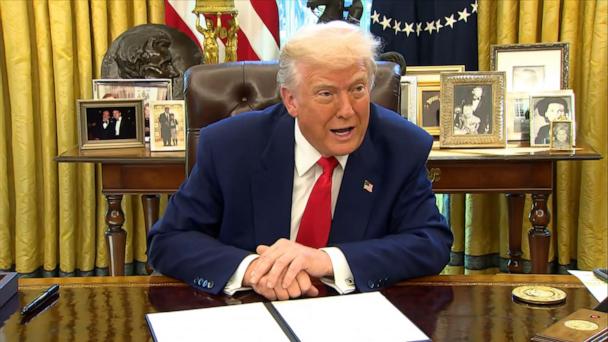
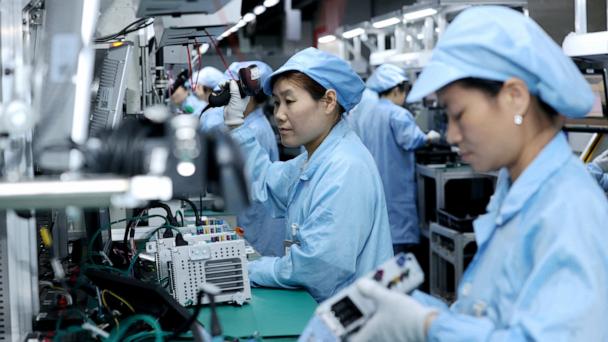
The Trump administration is exempting smartphones, computers, and other electronics from his reciprocal tariffs, according to a bulletin posted by U.S. Customs and Border Protection late Friday night.
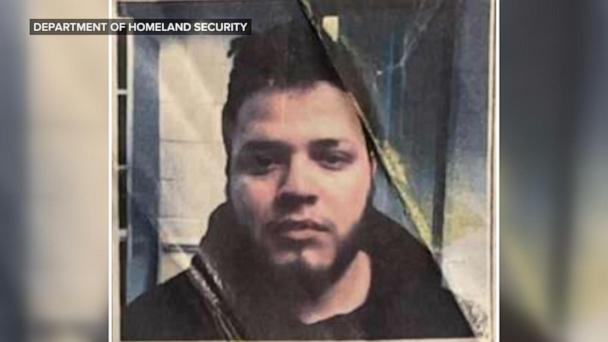
A DOJ attorney told a judge that he does "not have the information" regarding the whereabouts of Kilmar Armando Abrego Garcia, who was deported to El Salvador in error.
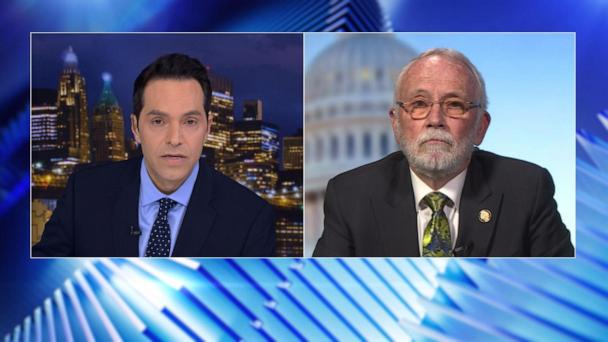
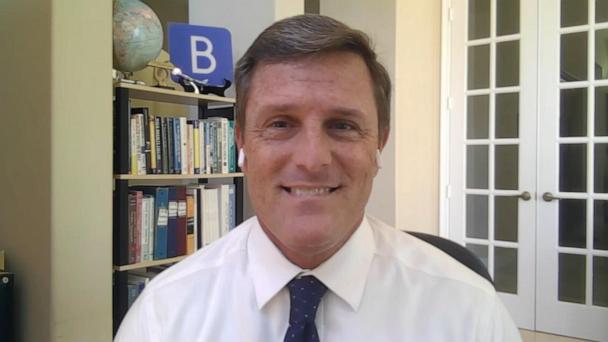
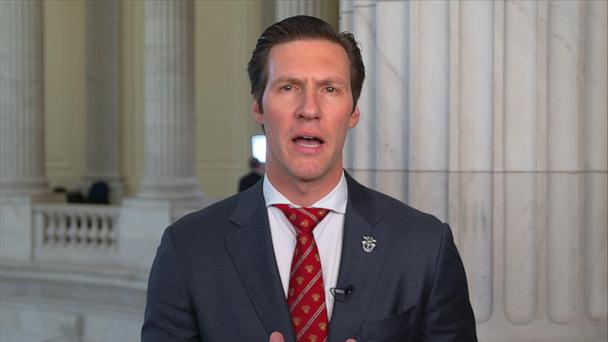
ABC News’ Phil Lipof spoke with Rep. Dan Newhouse, a Republican from Washington, about his co-sponsorship of a bill that would require congressional review of President Donald Trump's tariffs.
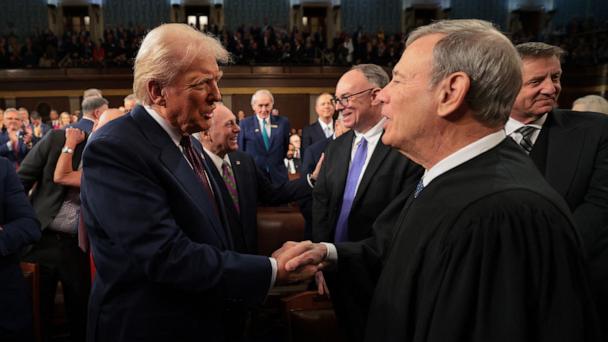
The Supreme Court will require the Trump administration to facilitate the return of Kilmar Abrego Garcia, the Maryland man who was sent to El Salvador in error.
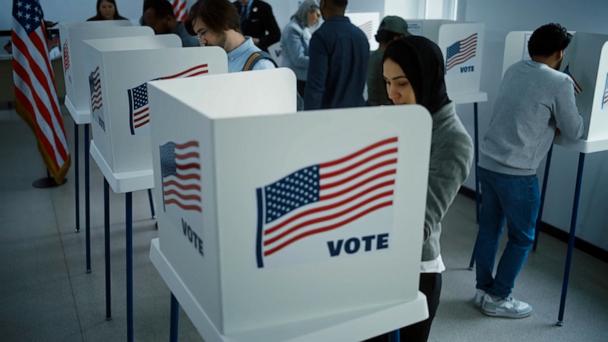
The Safeguard American Voter Eligibility Act, or SAVE Act, would require states to obtain "documentary" proof of citizenship in person before registering an individual to vote for a federal election.
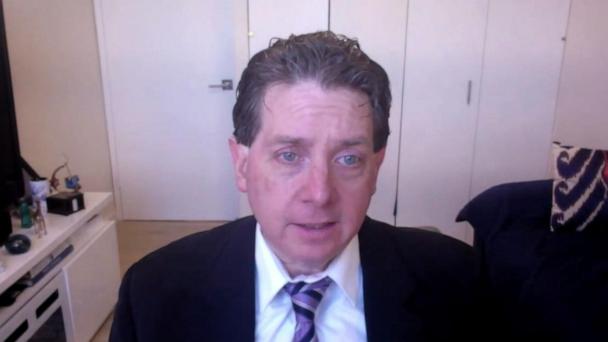
Bankrate chief financial analyst Greg McBride discusses the data which arrives a day after President Donald Trump paused some tariffs and U.S. stocks rallied.
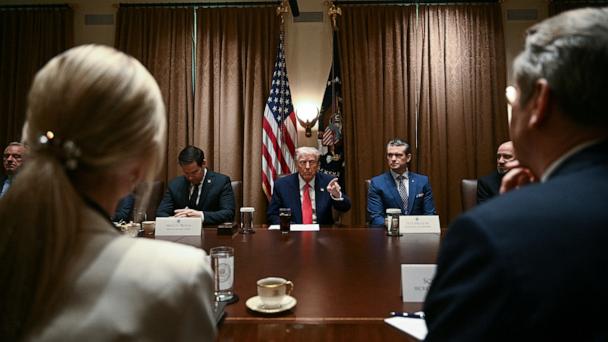
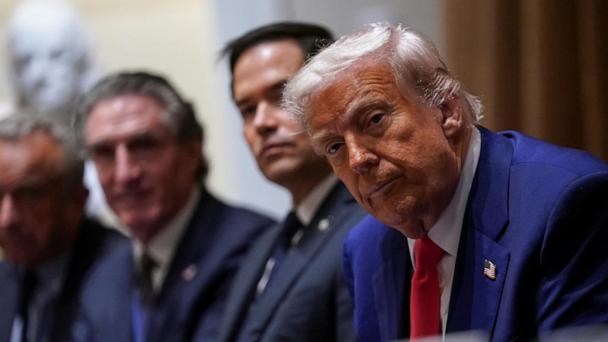
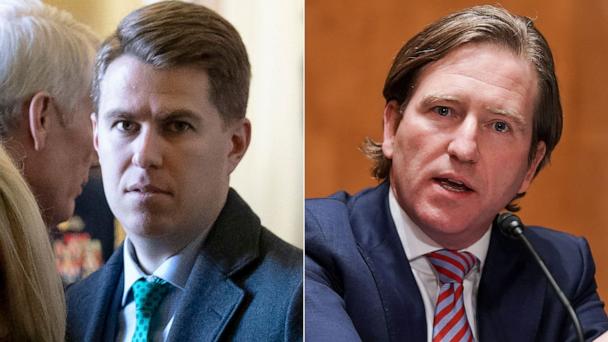
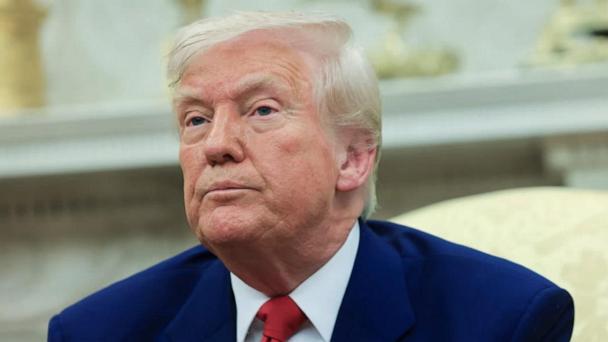
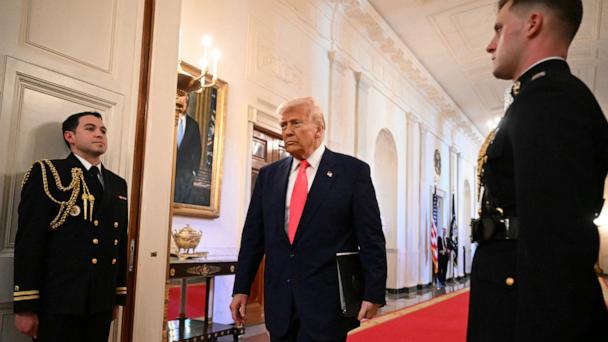
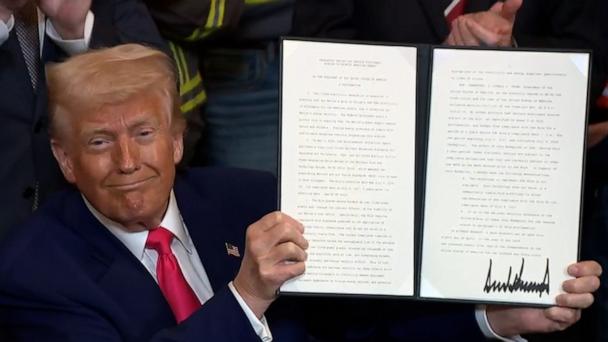
President Donald Trump signed an executive order asking the Justice Department to investigate two senior officials from his first administration, Miles Taylor and Chris Krebs.
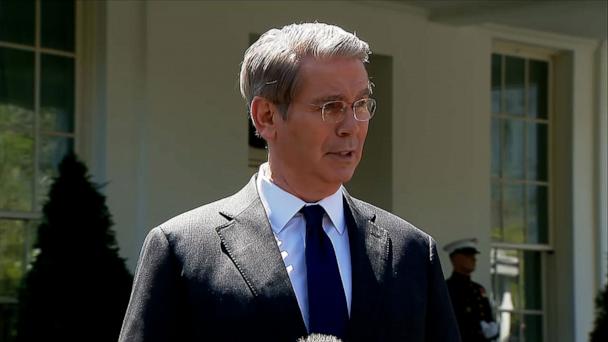
Treasury Secretary Scott Bessent responds to questions after President Donald Trump announced a 90-day pause on some tariffs for countries except China.
New York University’s Stern School of Business economics professor Joseph Foudy discusses President Donald Trump’s move to lower reciprocal tariffs for 90 days, except on China.
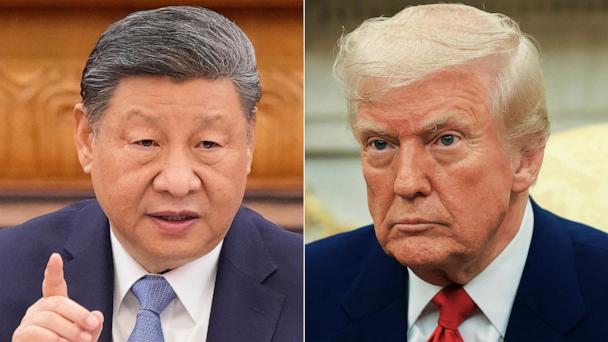
Michael Sobolik, senior fellow at the Hudson Institute, reacted to President Donald Trump announcing increased tariffs on China, raising the rate on Chinese goods from 104% to 125%.
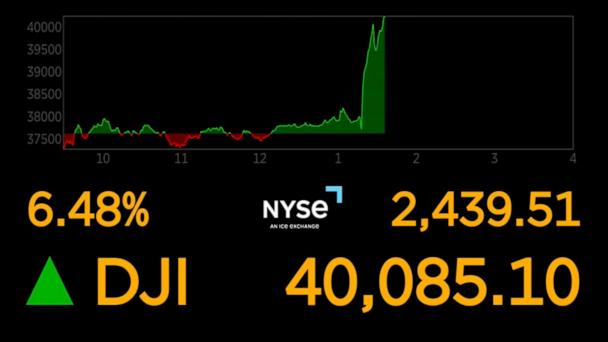
President Donald Trump has announced that countries subject to reciprocal tariffs will have a lowered 10% rate for 90 days, according to a new social media post.
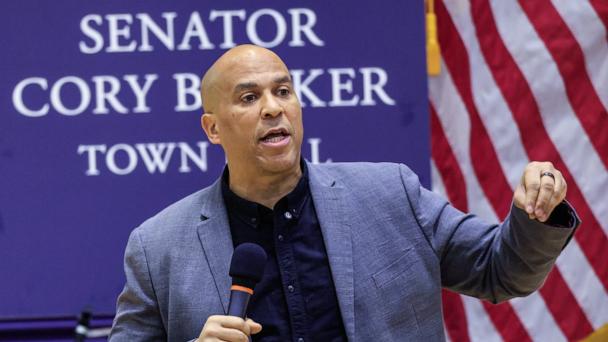
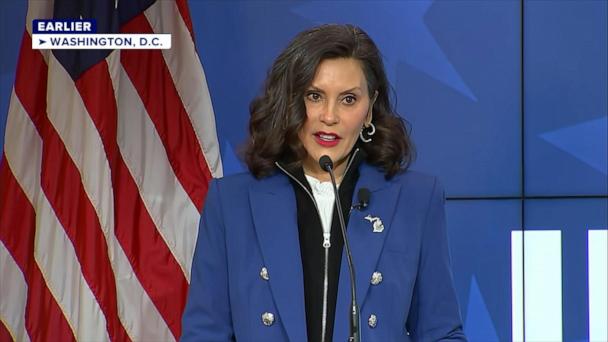
ABC News’ political director Averi Harper previews the Democratic governor's meeting with President Donald Trump amid speculation she’ll run for president in 2028.
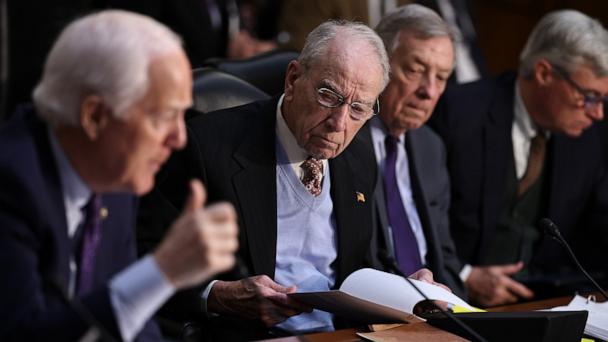
Republican senators are confronting the Trump administration with concerns about the economic impacts of President Donald Trump’s sweeping tariff strategy.
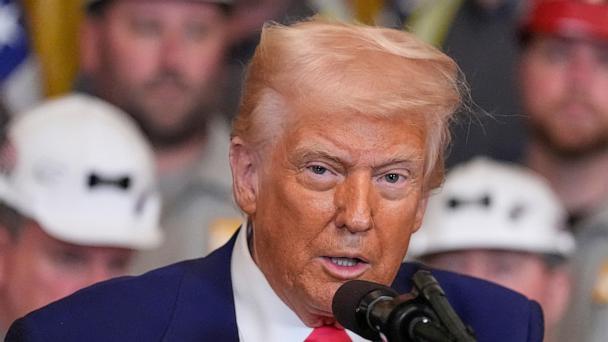
President Donald Trump has called for the expansion of U.S. coal production, claiming that an increase of "clean" coal produced in the U.S. will soon take place.