Political News

Latest Videos

2:39
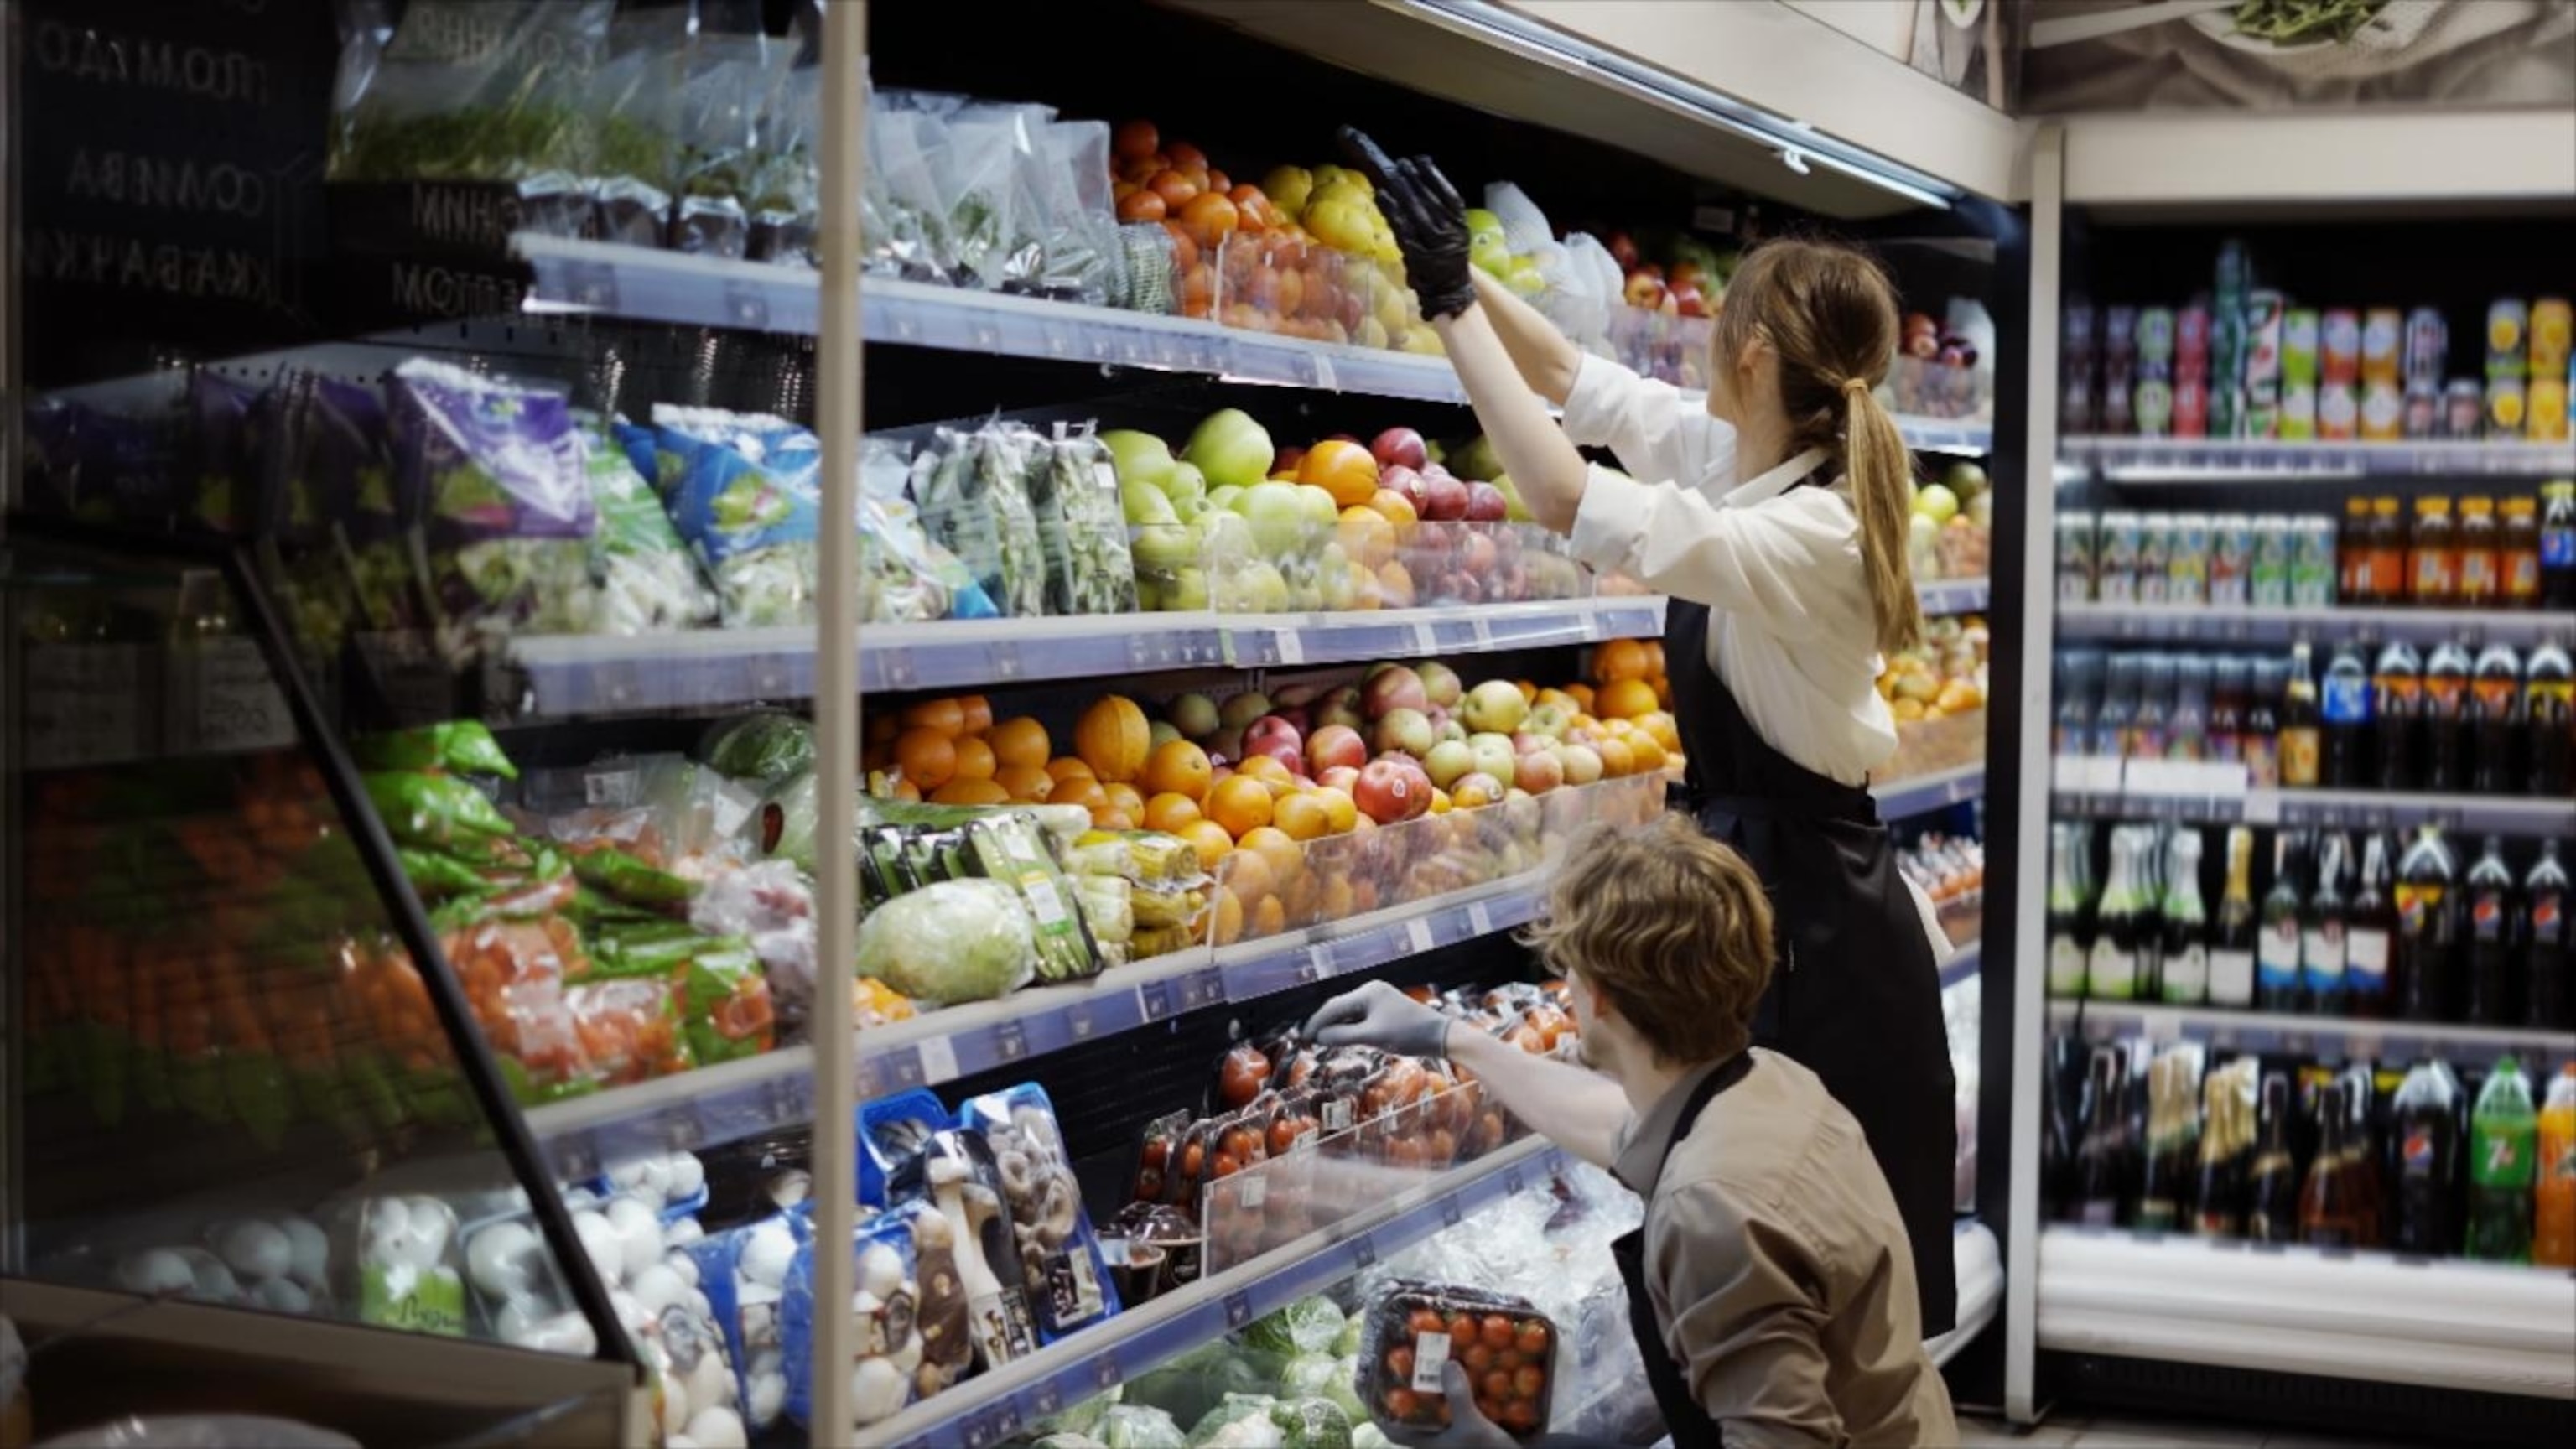
White House says it plans to use tariff revenue to run WIC nutrition program
- 3 hours ago
4:46
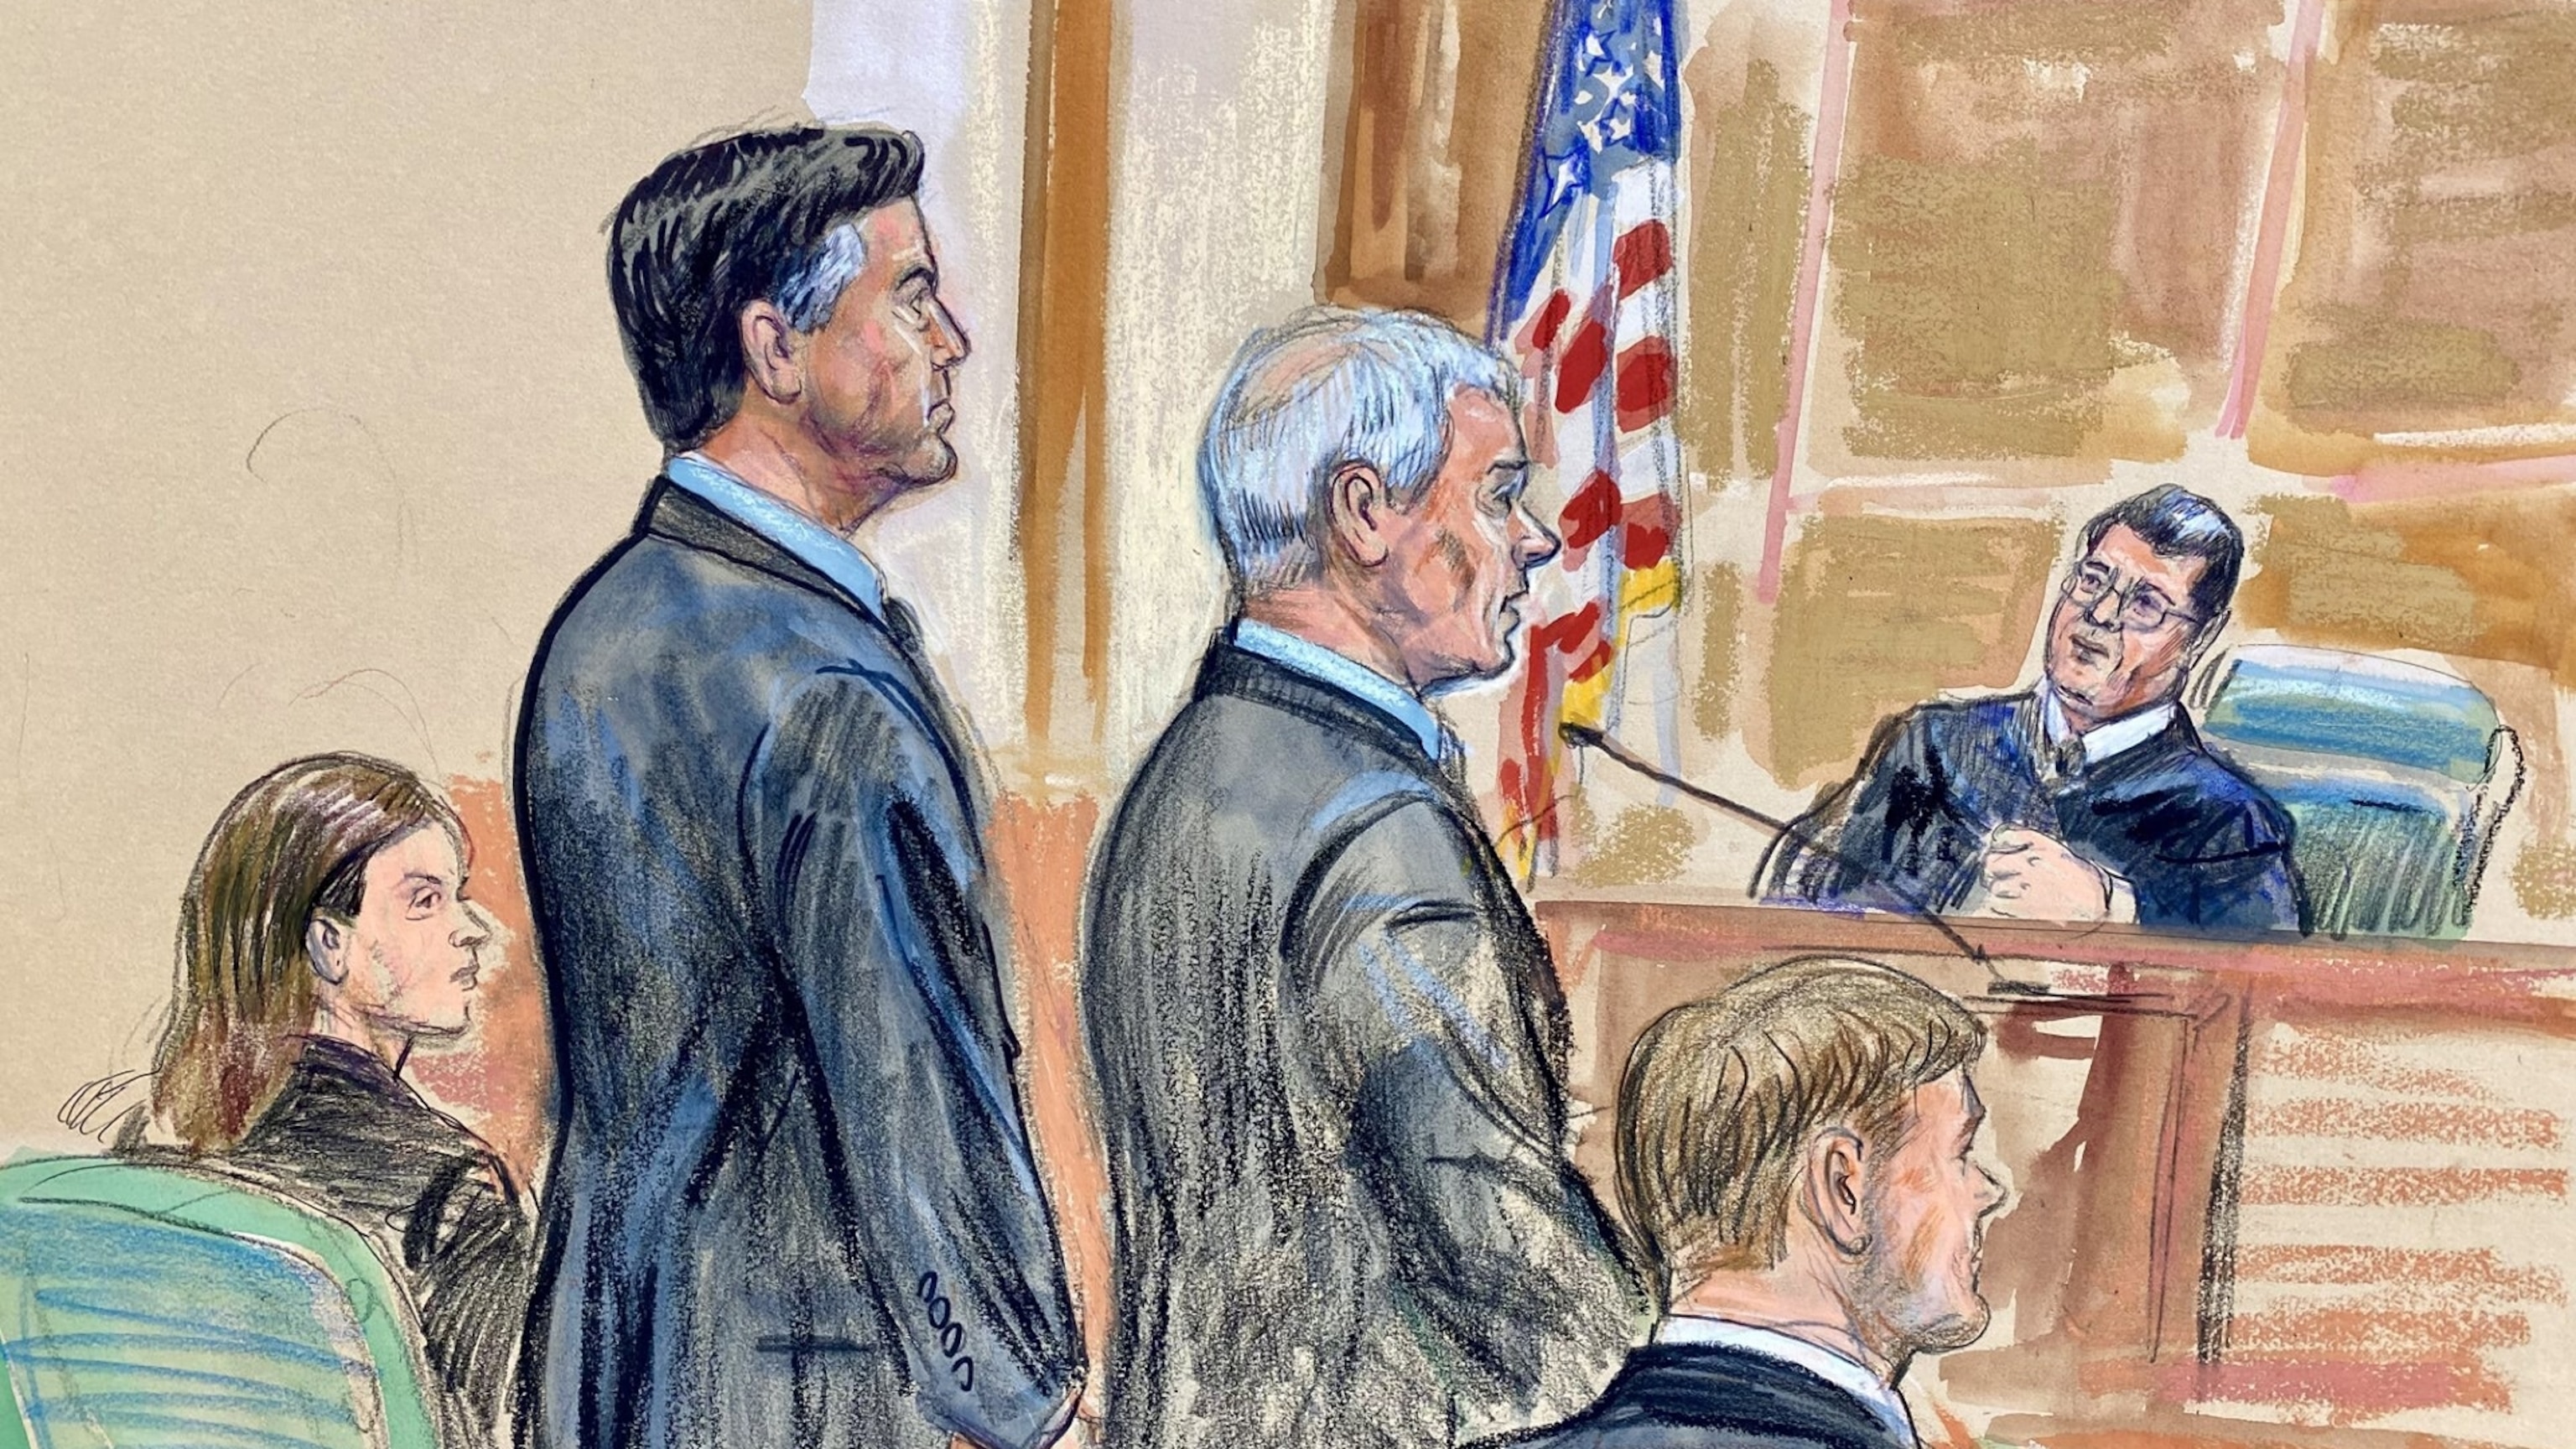
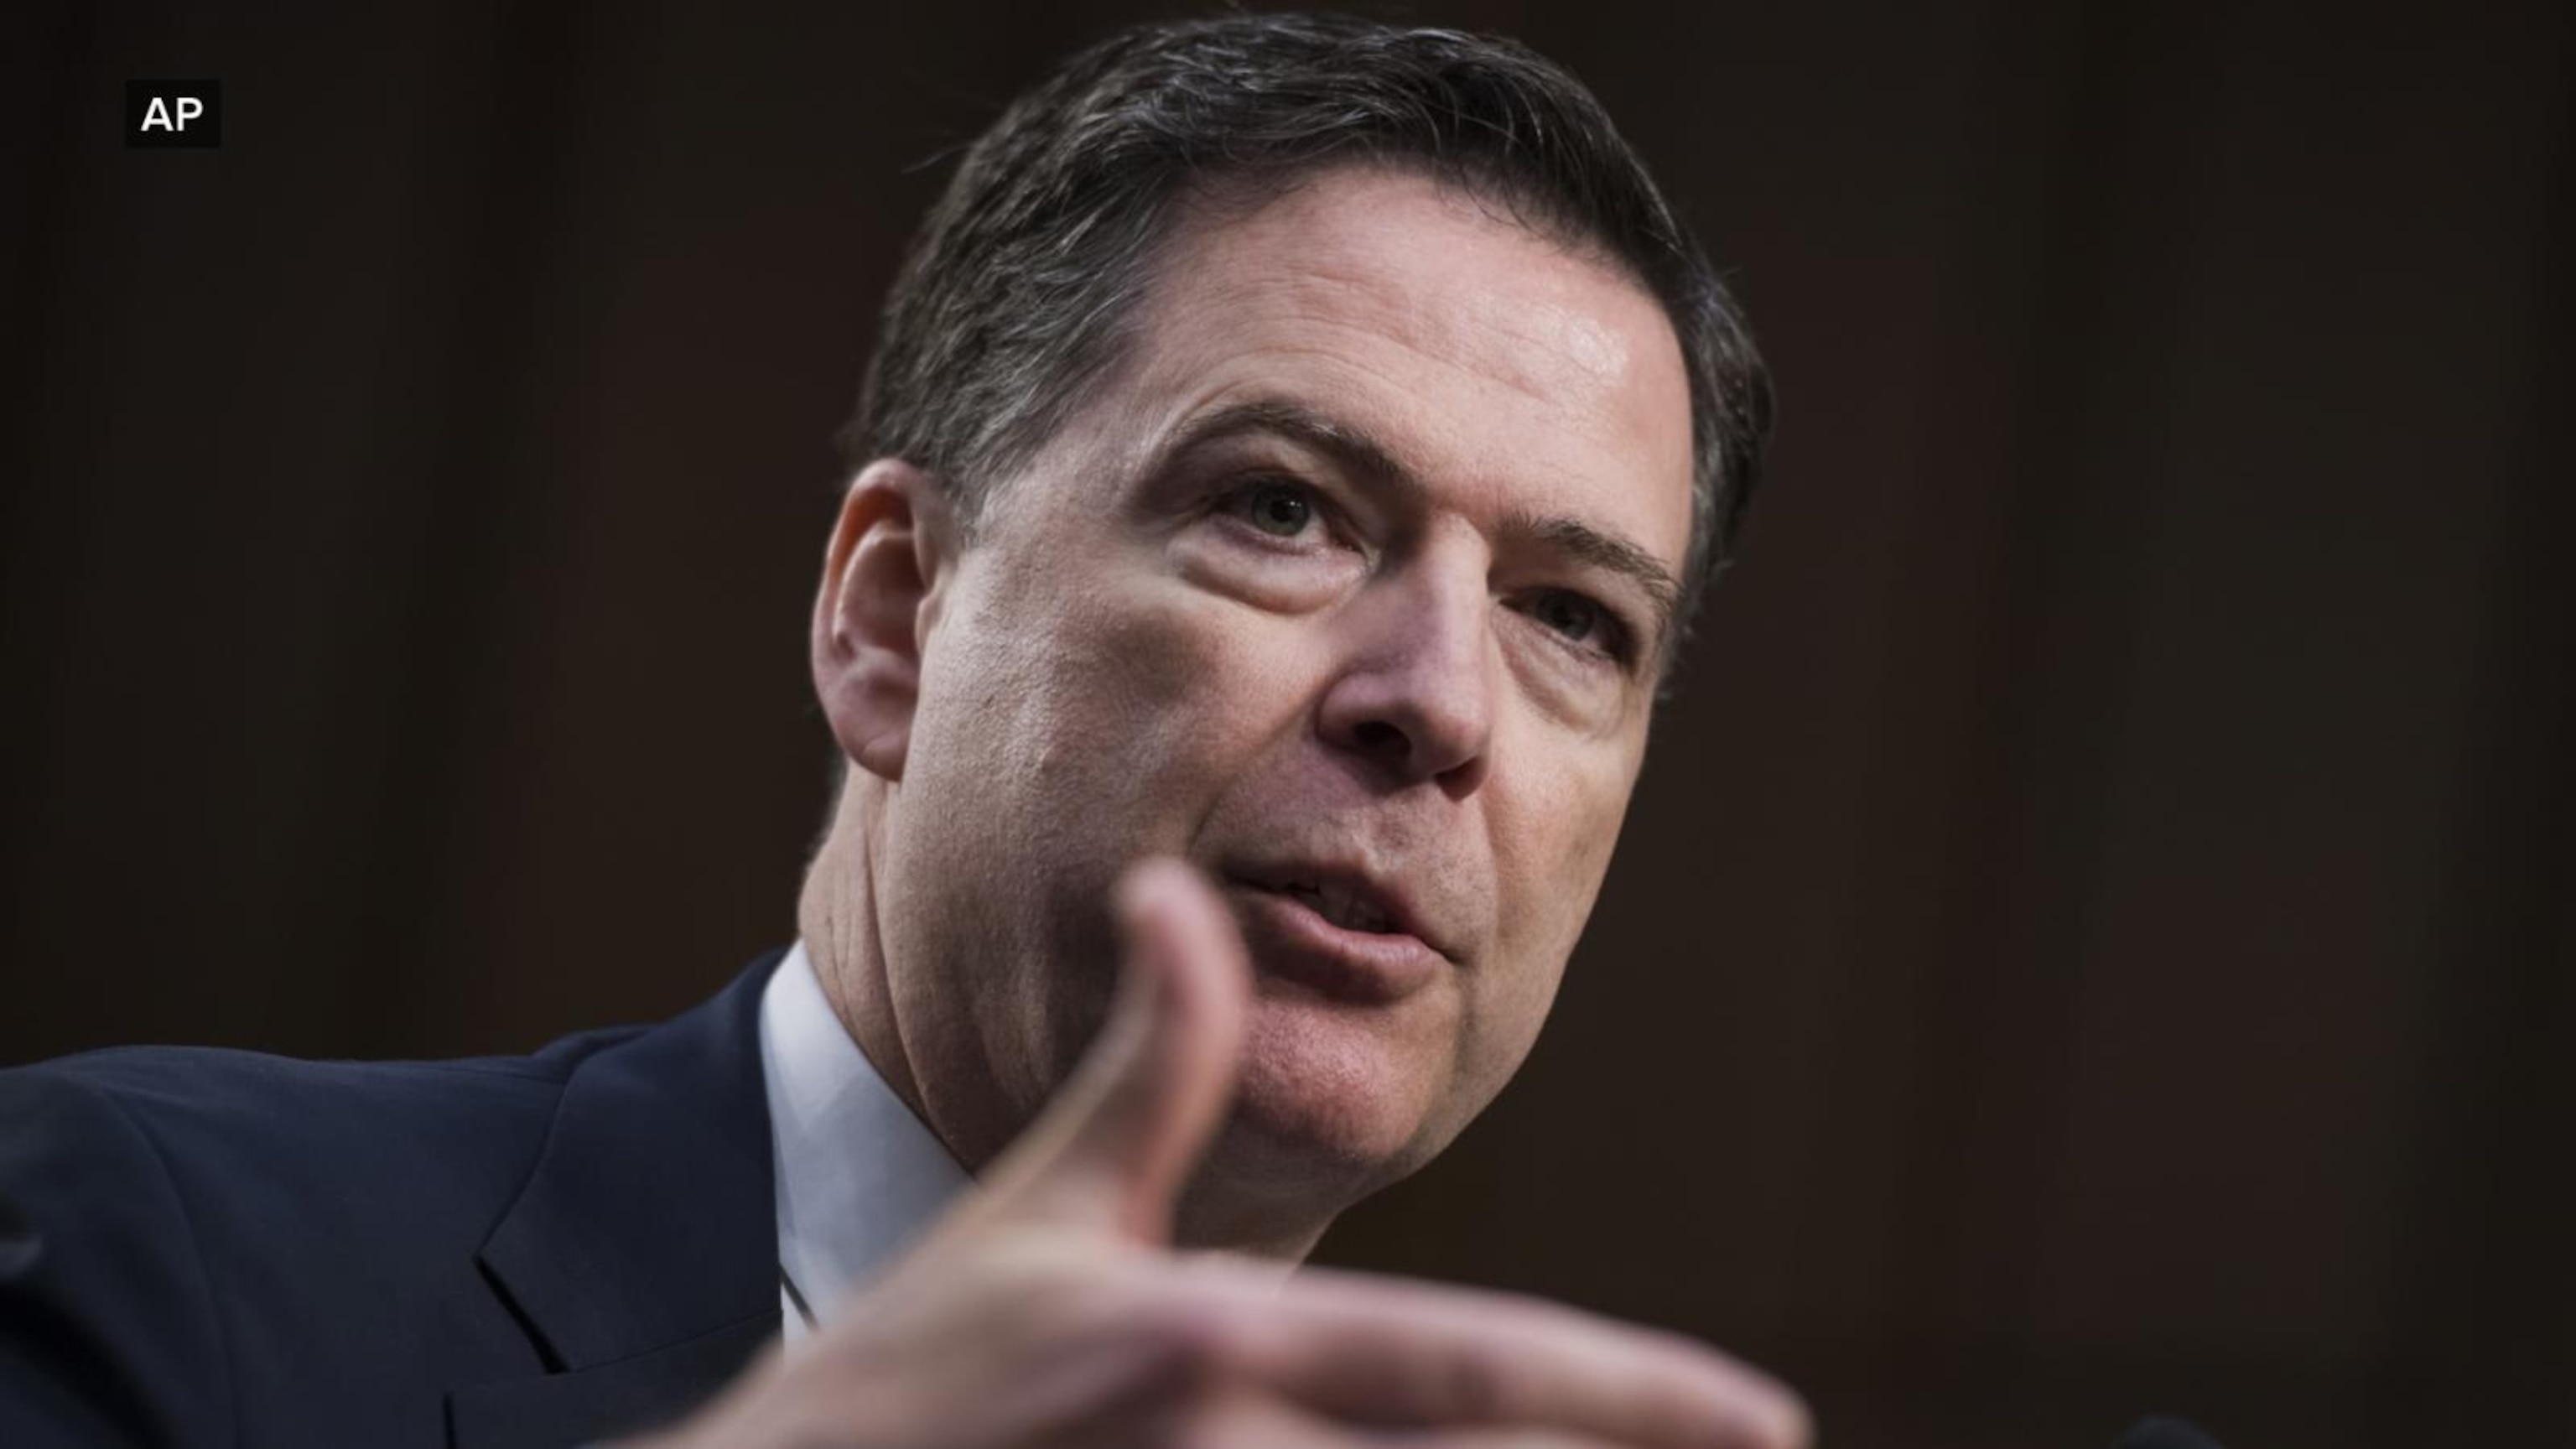
Former federal prosecutor on James Comey trial
- 4 hours ago
4:53
Sen. Katie Britt on funding impasse
- 4 hours ago
0:40
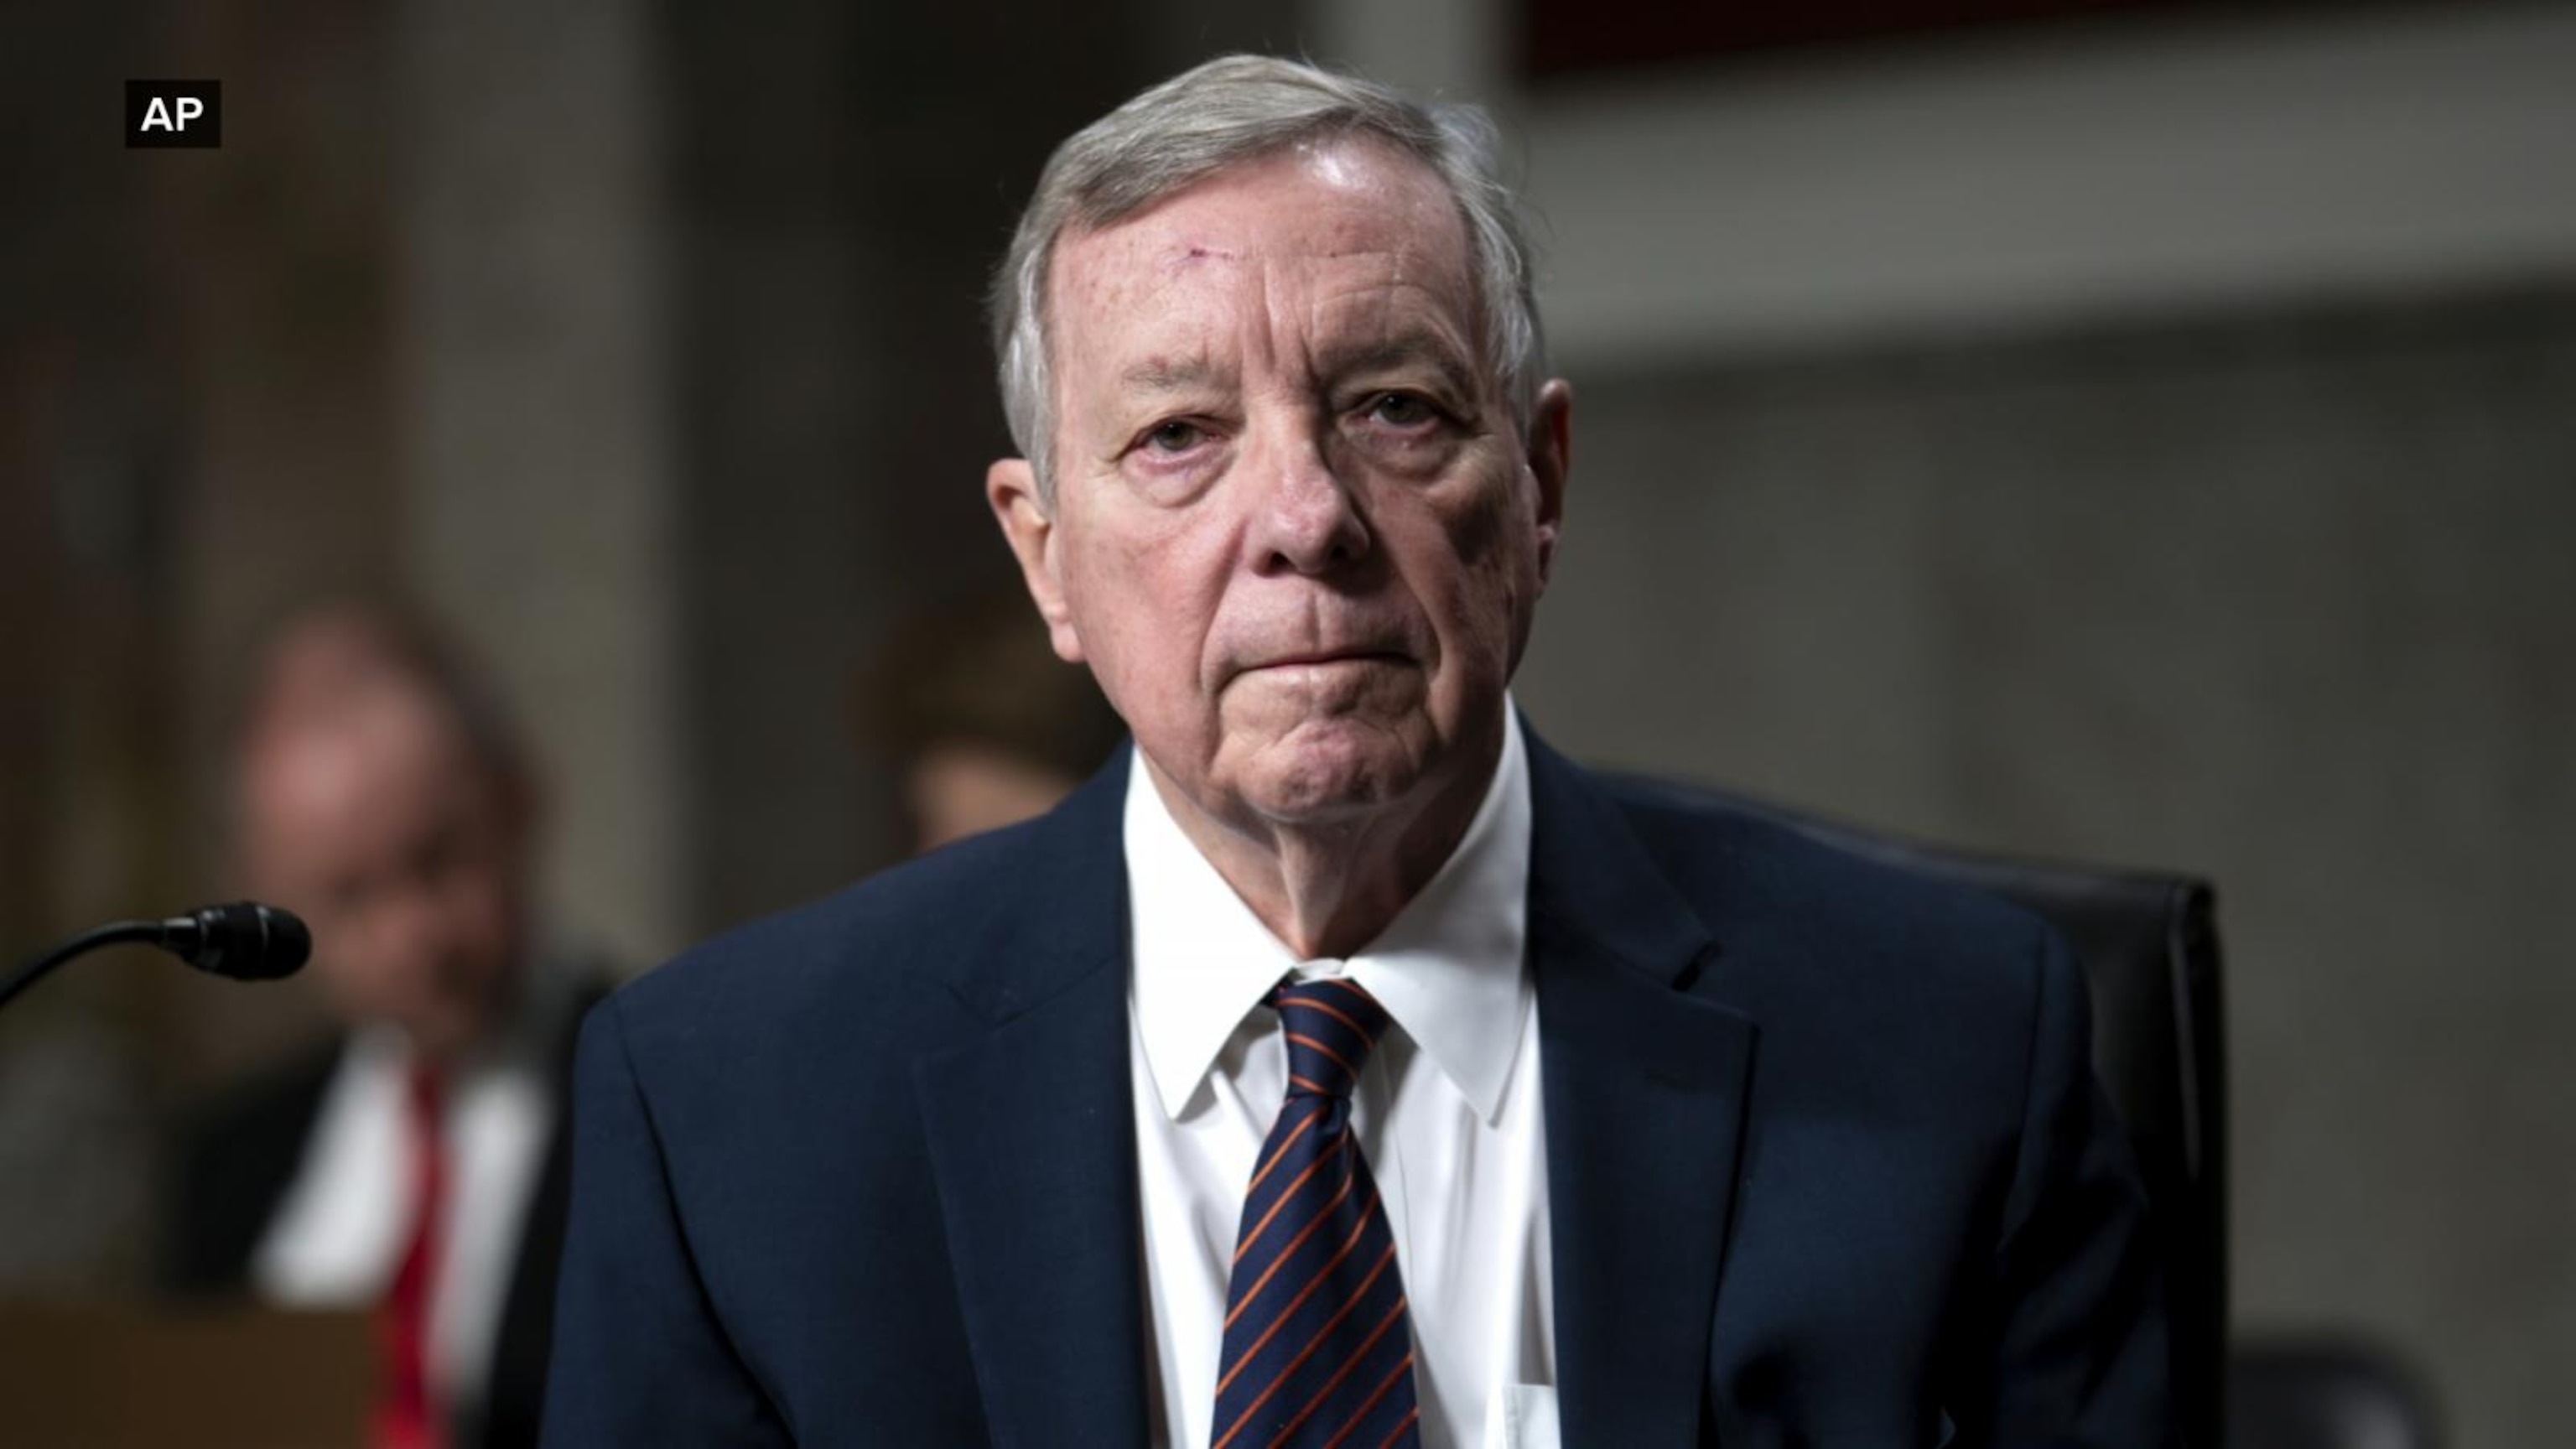
Sen. Dick Durbin says Trump administration would 'make even President Nixon recoil'
- 1 day ago
4:56
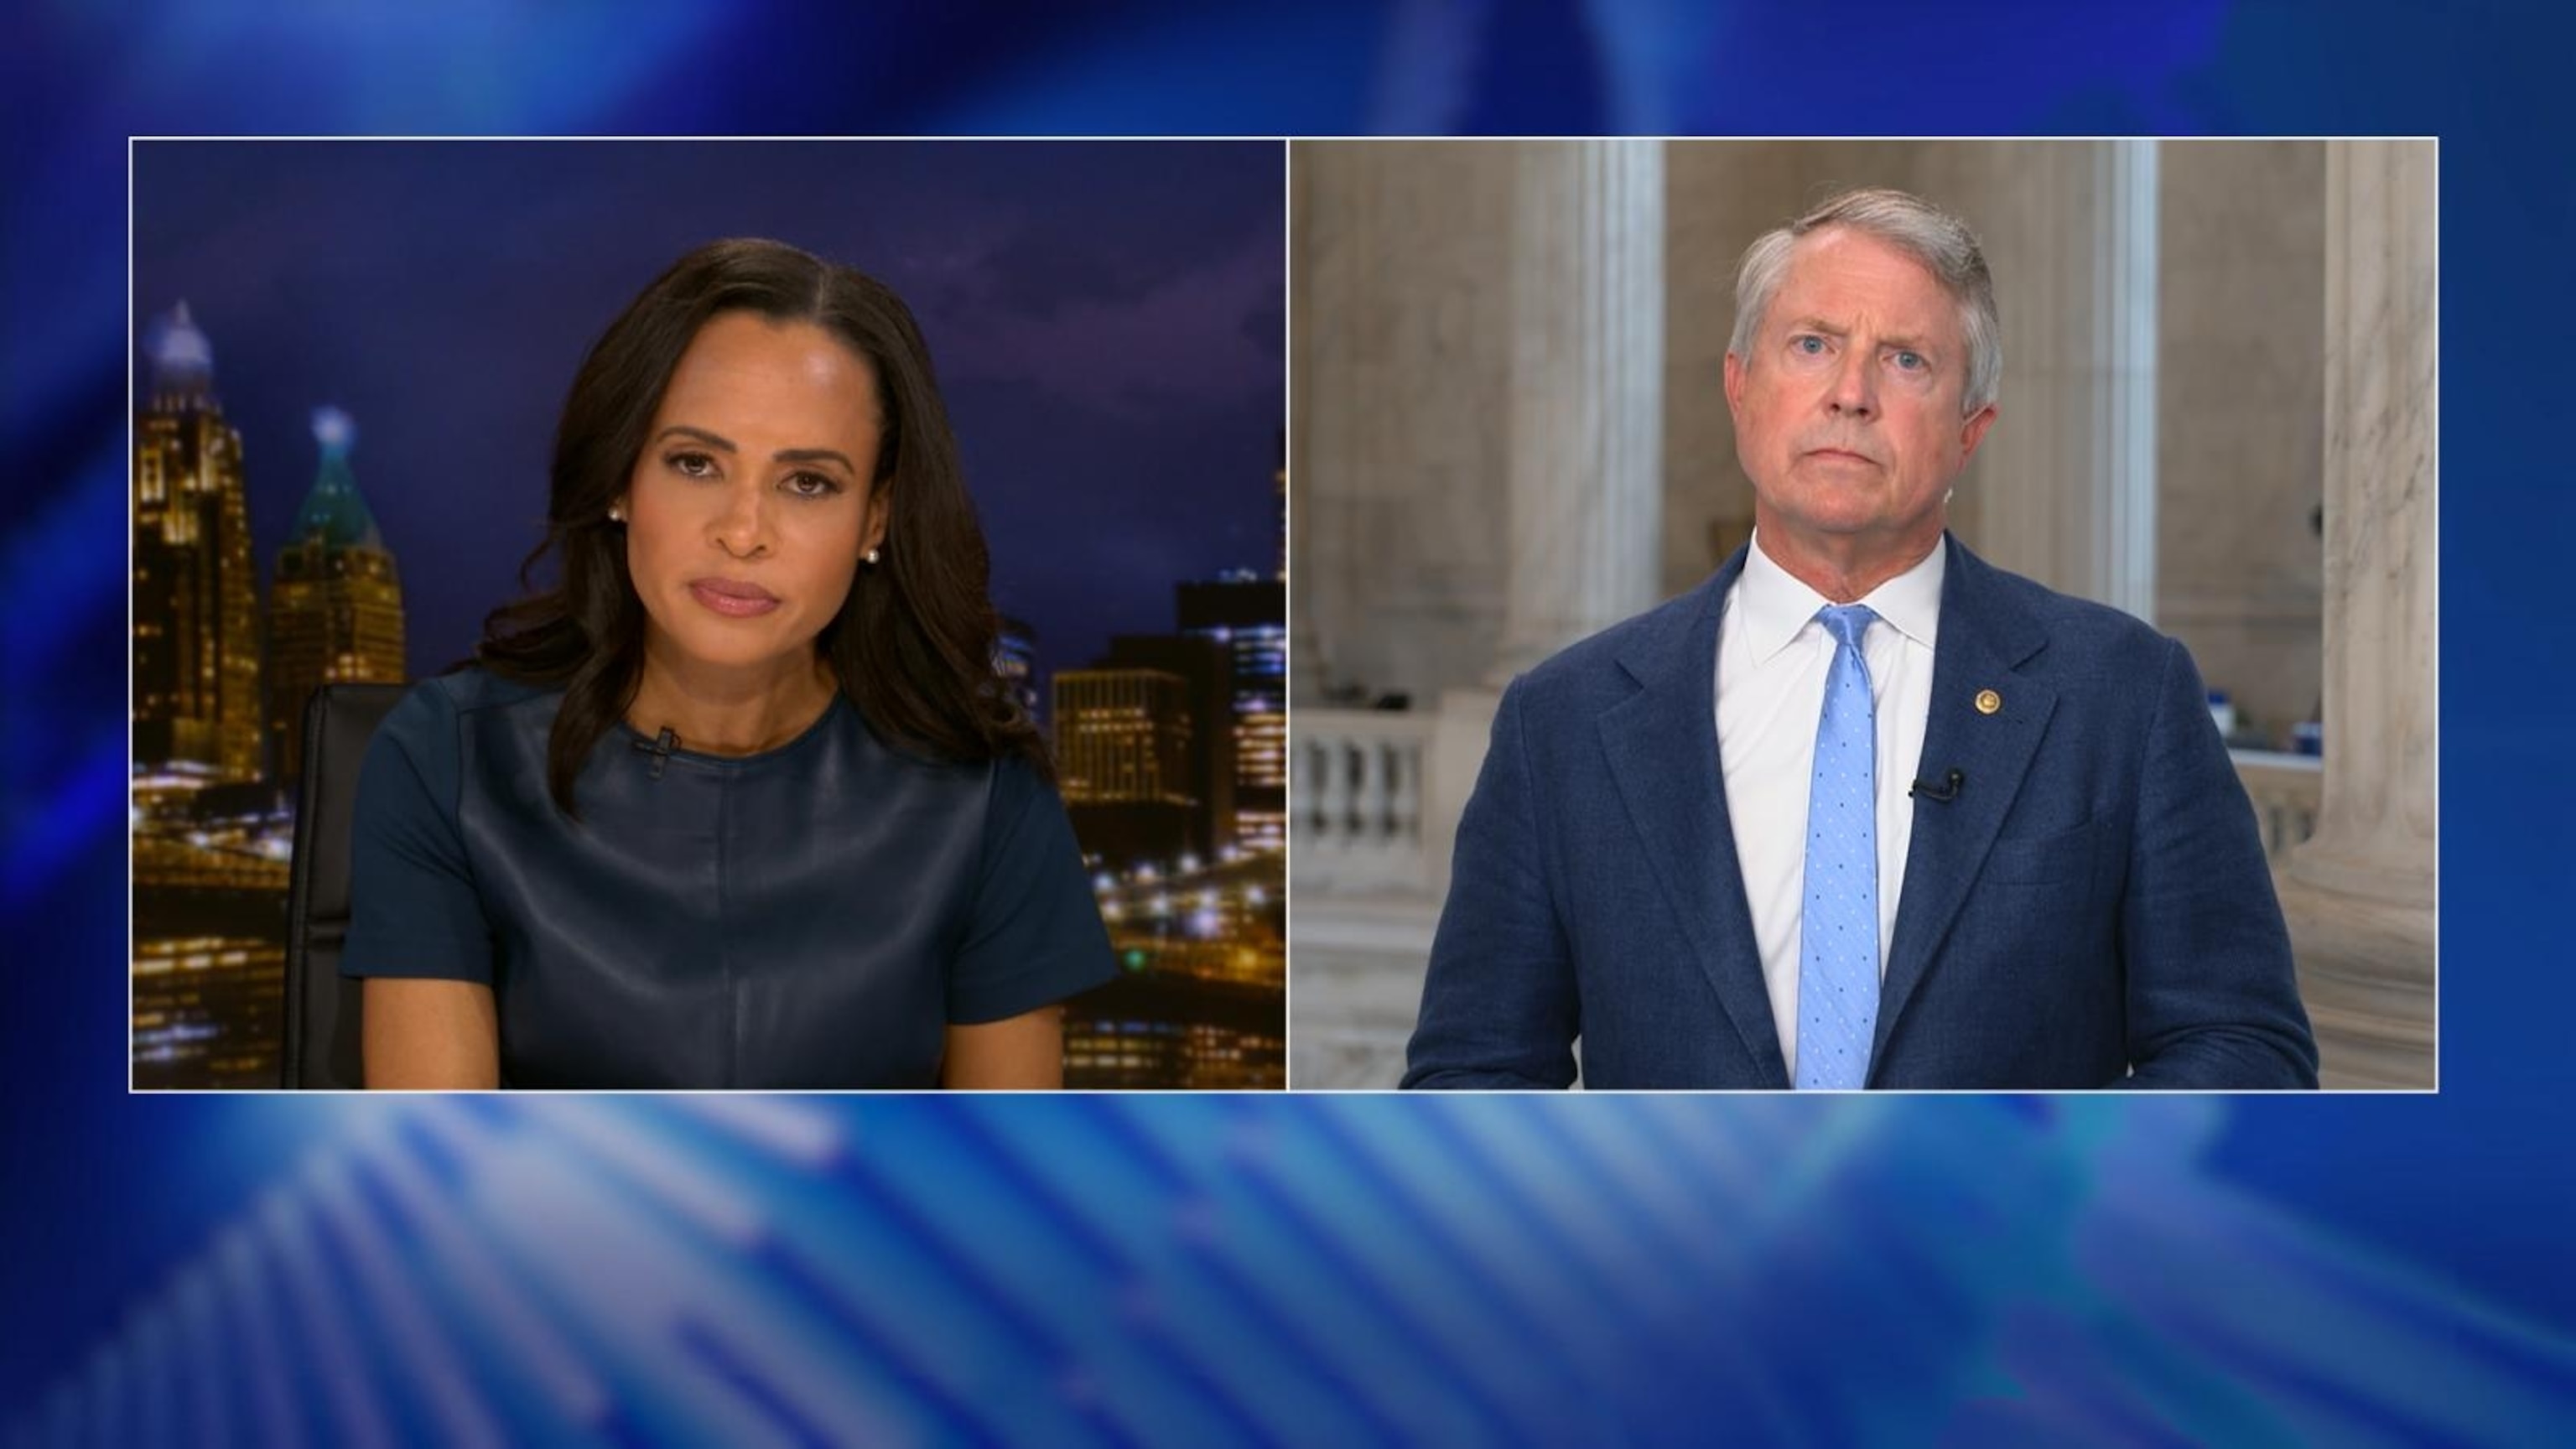
Sen. Roger Marshall on National Guard deployment and COVID vaccine guidelines
- 1 day ago
4:57
Senator Jeff Merkley on ongoing government shutdown
- 1 day ago

6:53
Rep. Malliotakis on Trump threatening NYC funding
- 1 day ago
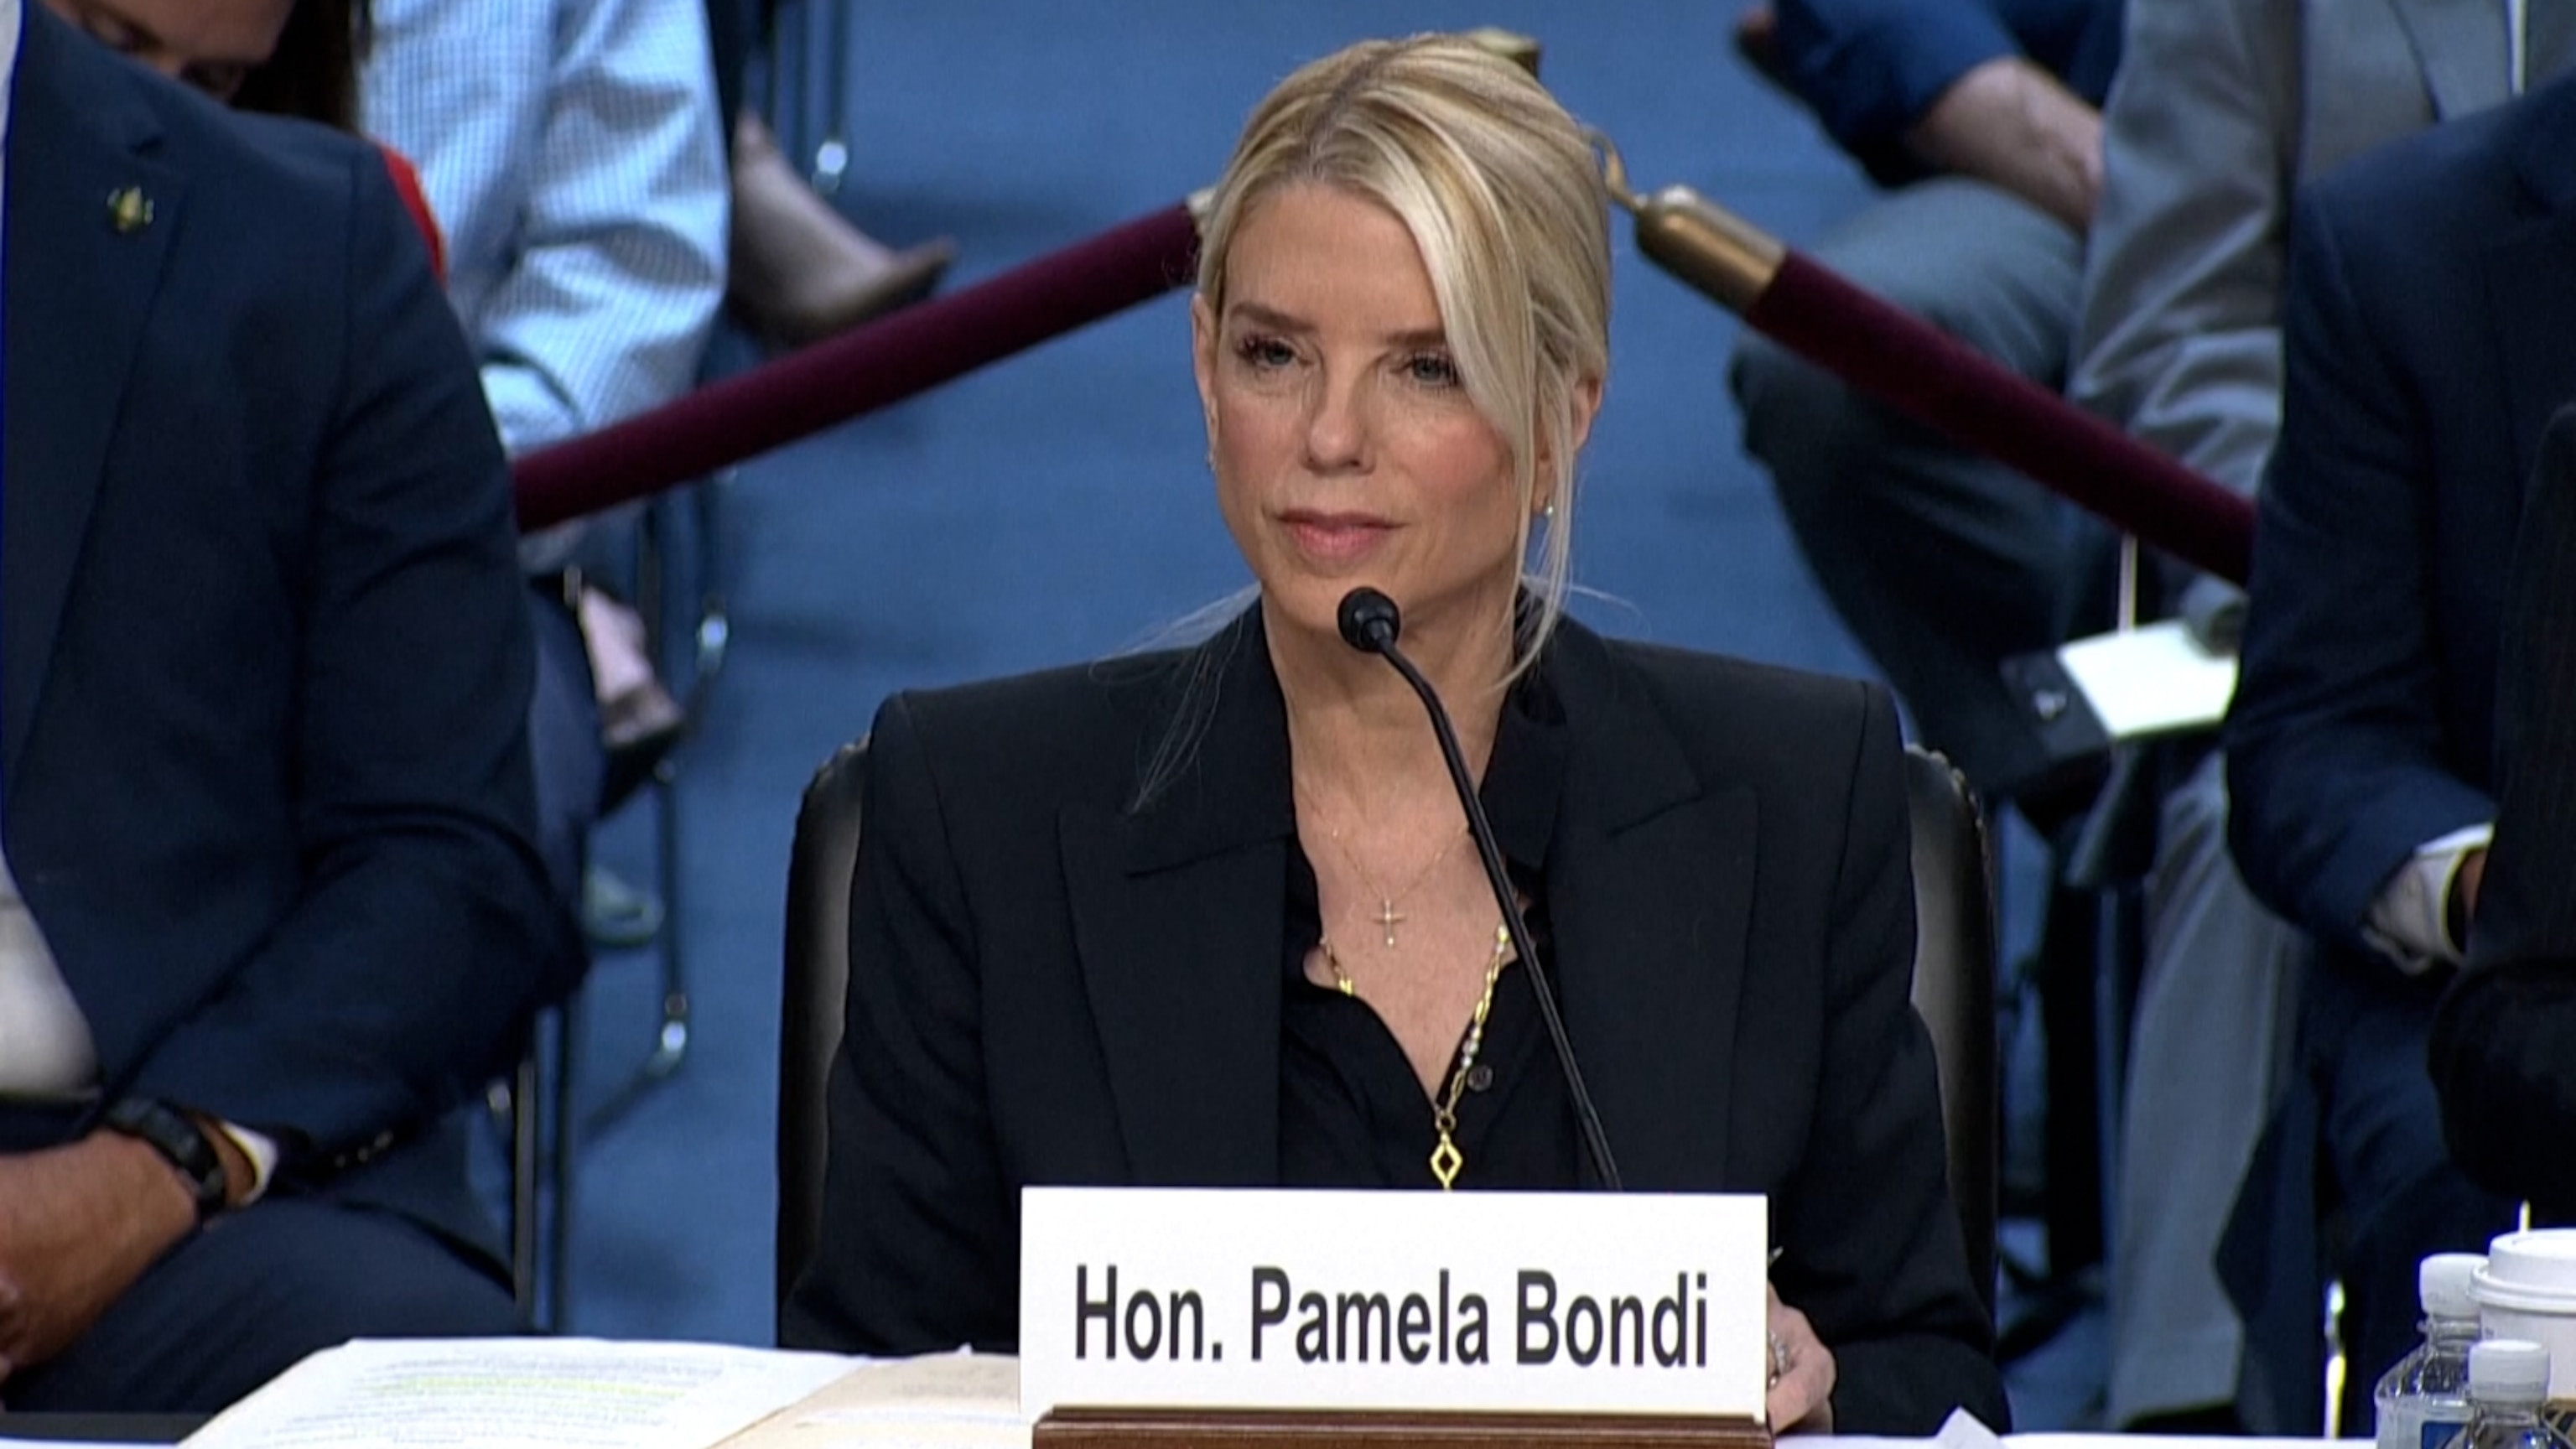
5:03
Key moments from Attorney General Pam Bondi's Senate hearing
- 1 day ago
5:54
New York Rep. Adriano Espaillat on government shutdown
- 1 day ago

2:53
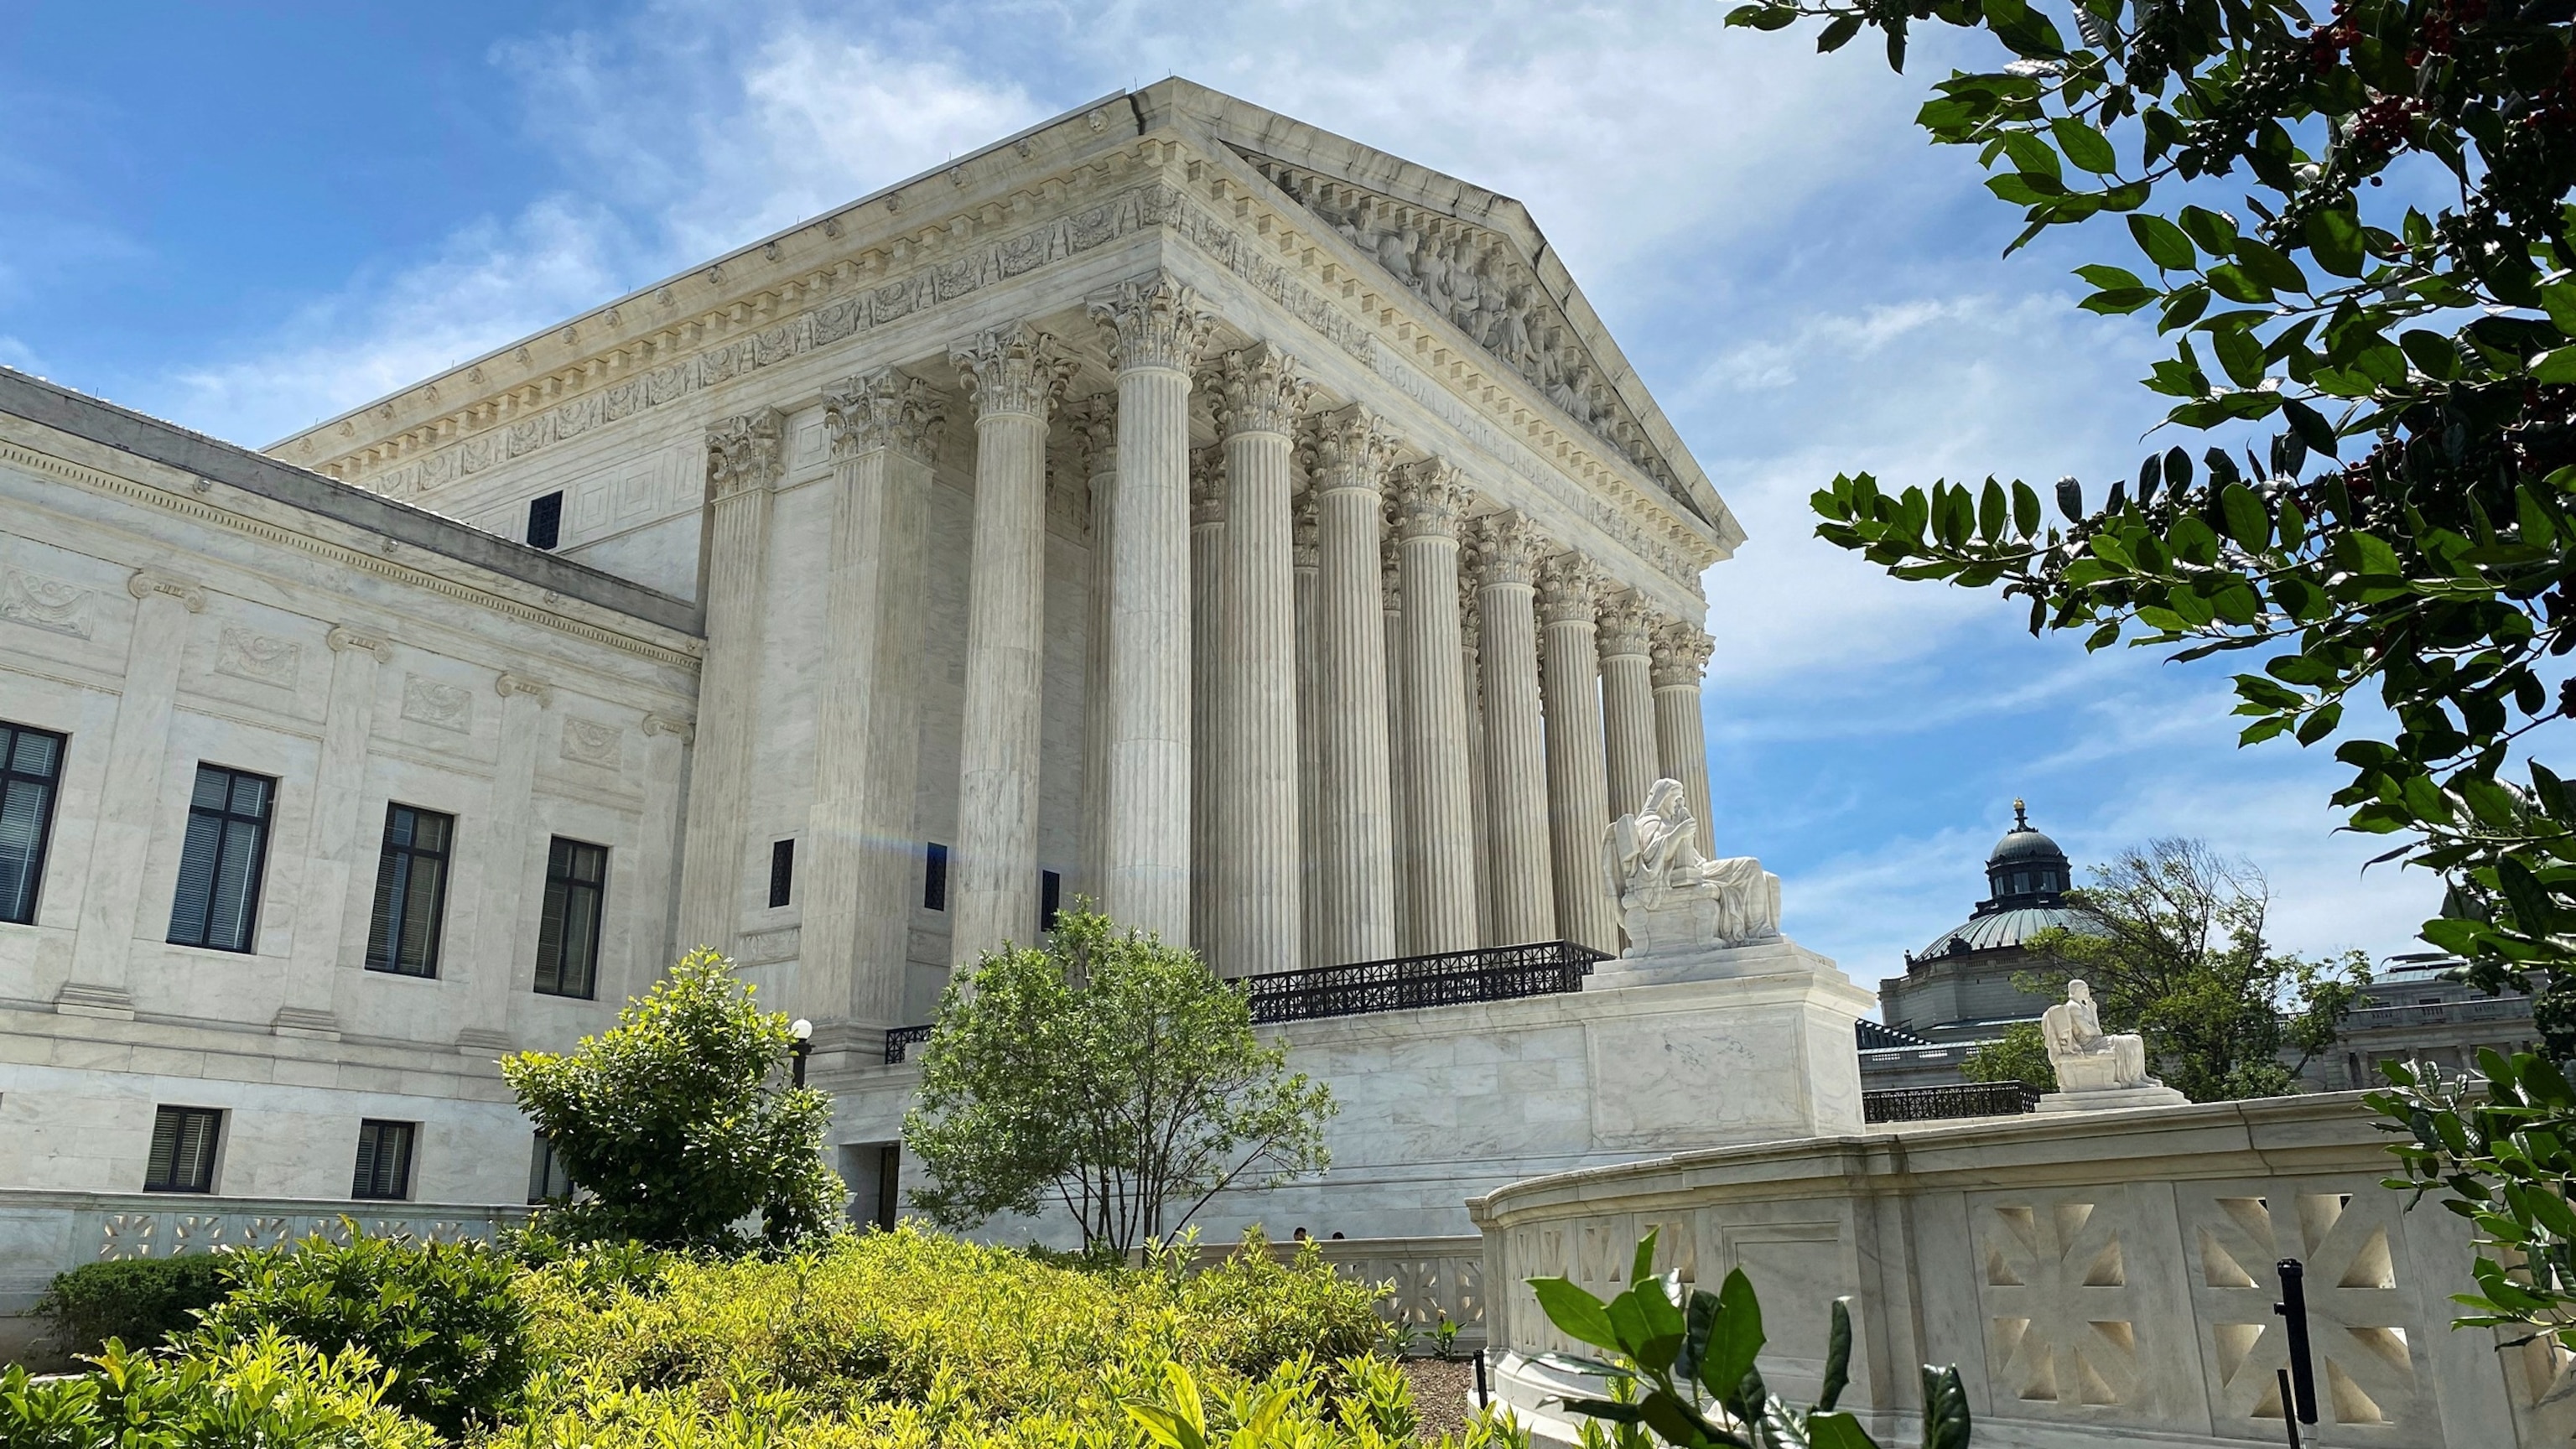
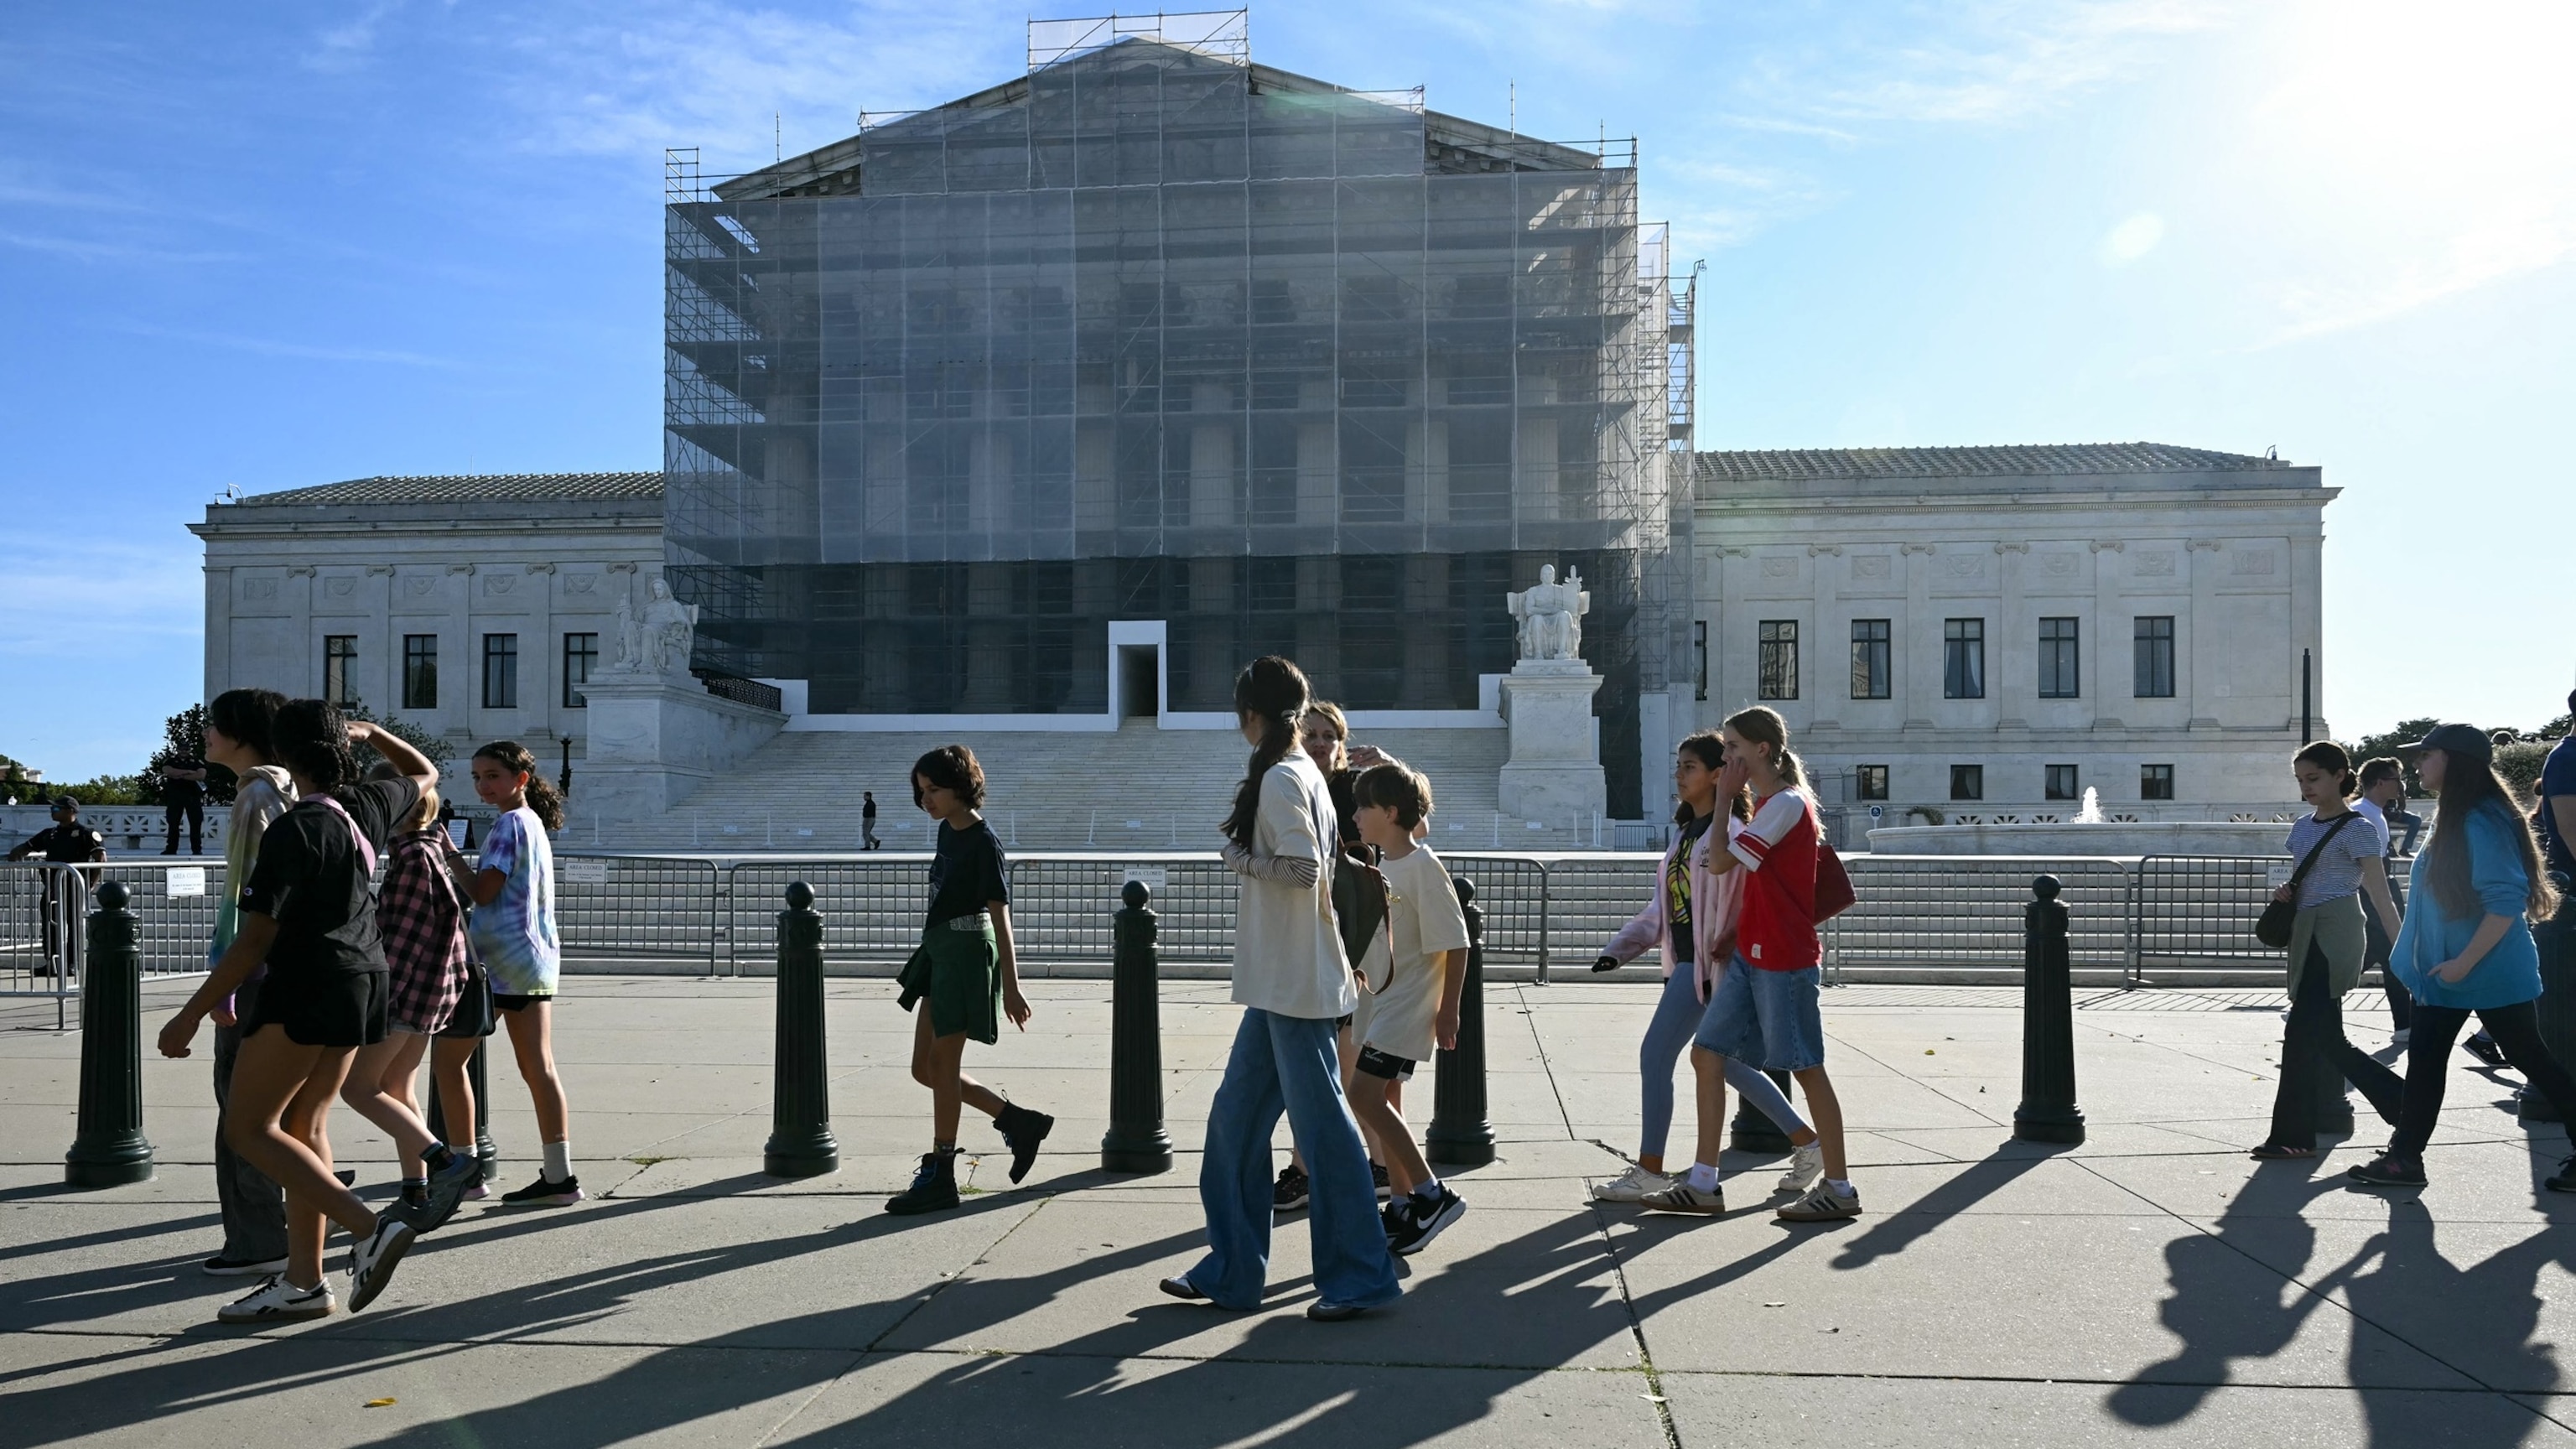
Oral arguments in LGBTQ 'conversion therapy' case
- 1 day ago
Playlist · 10 Videos