Political News


Latest Videos
3:51
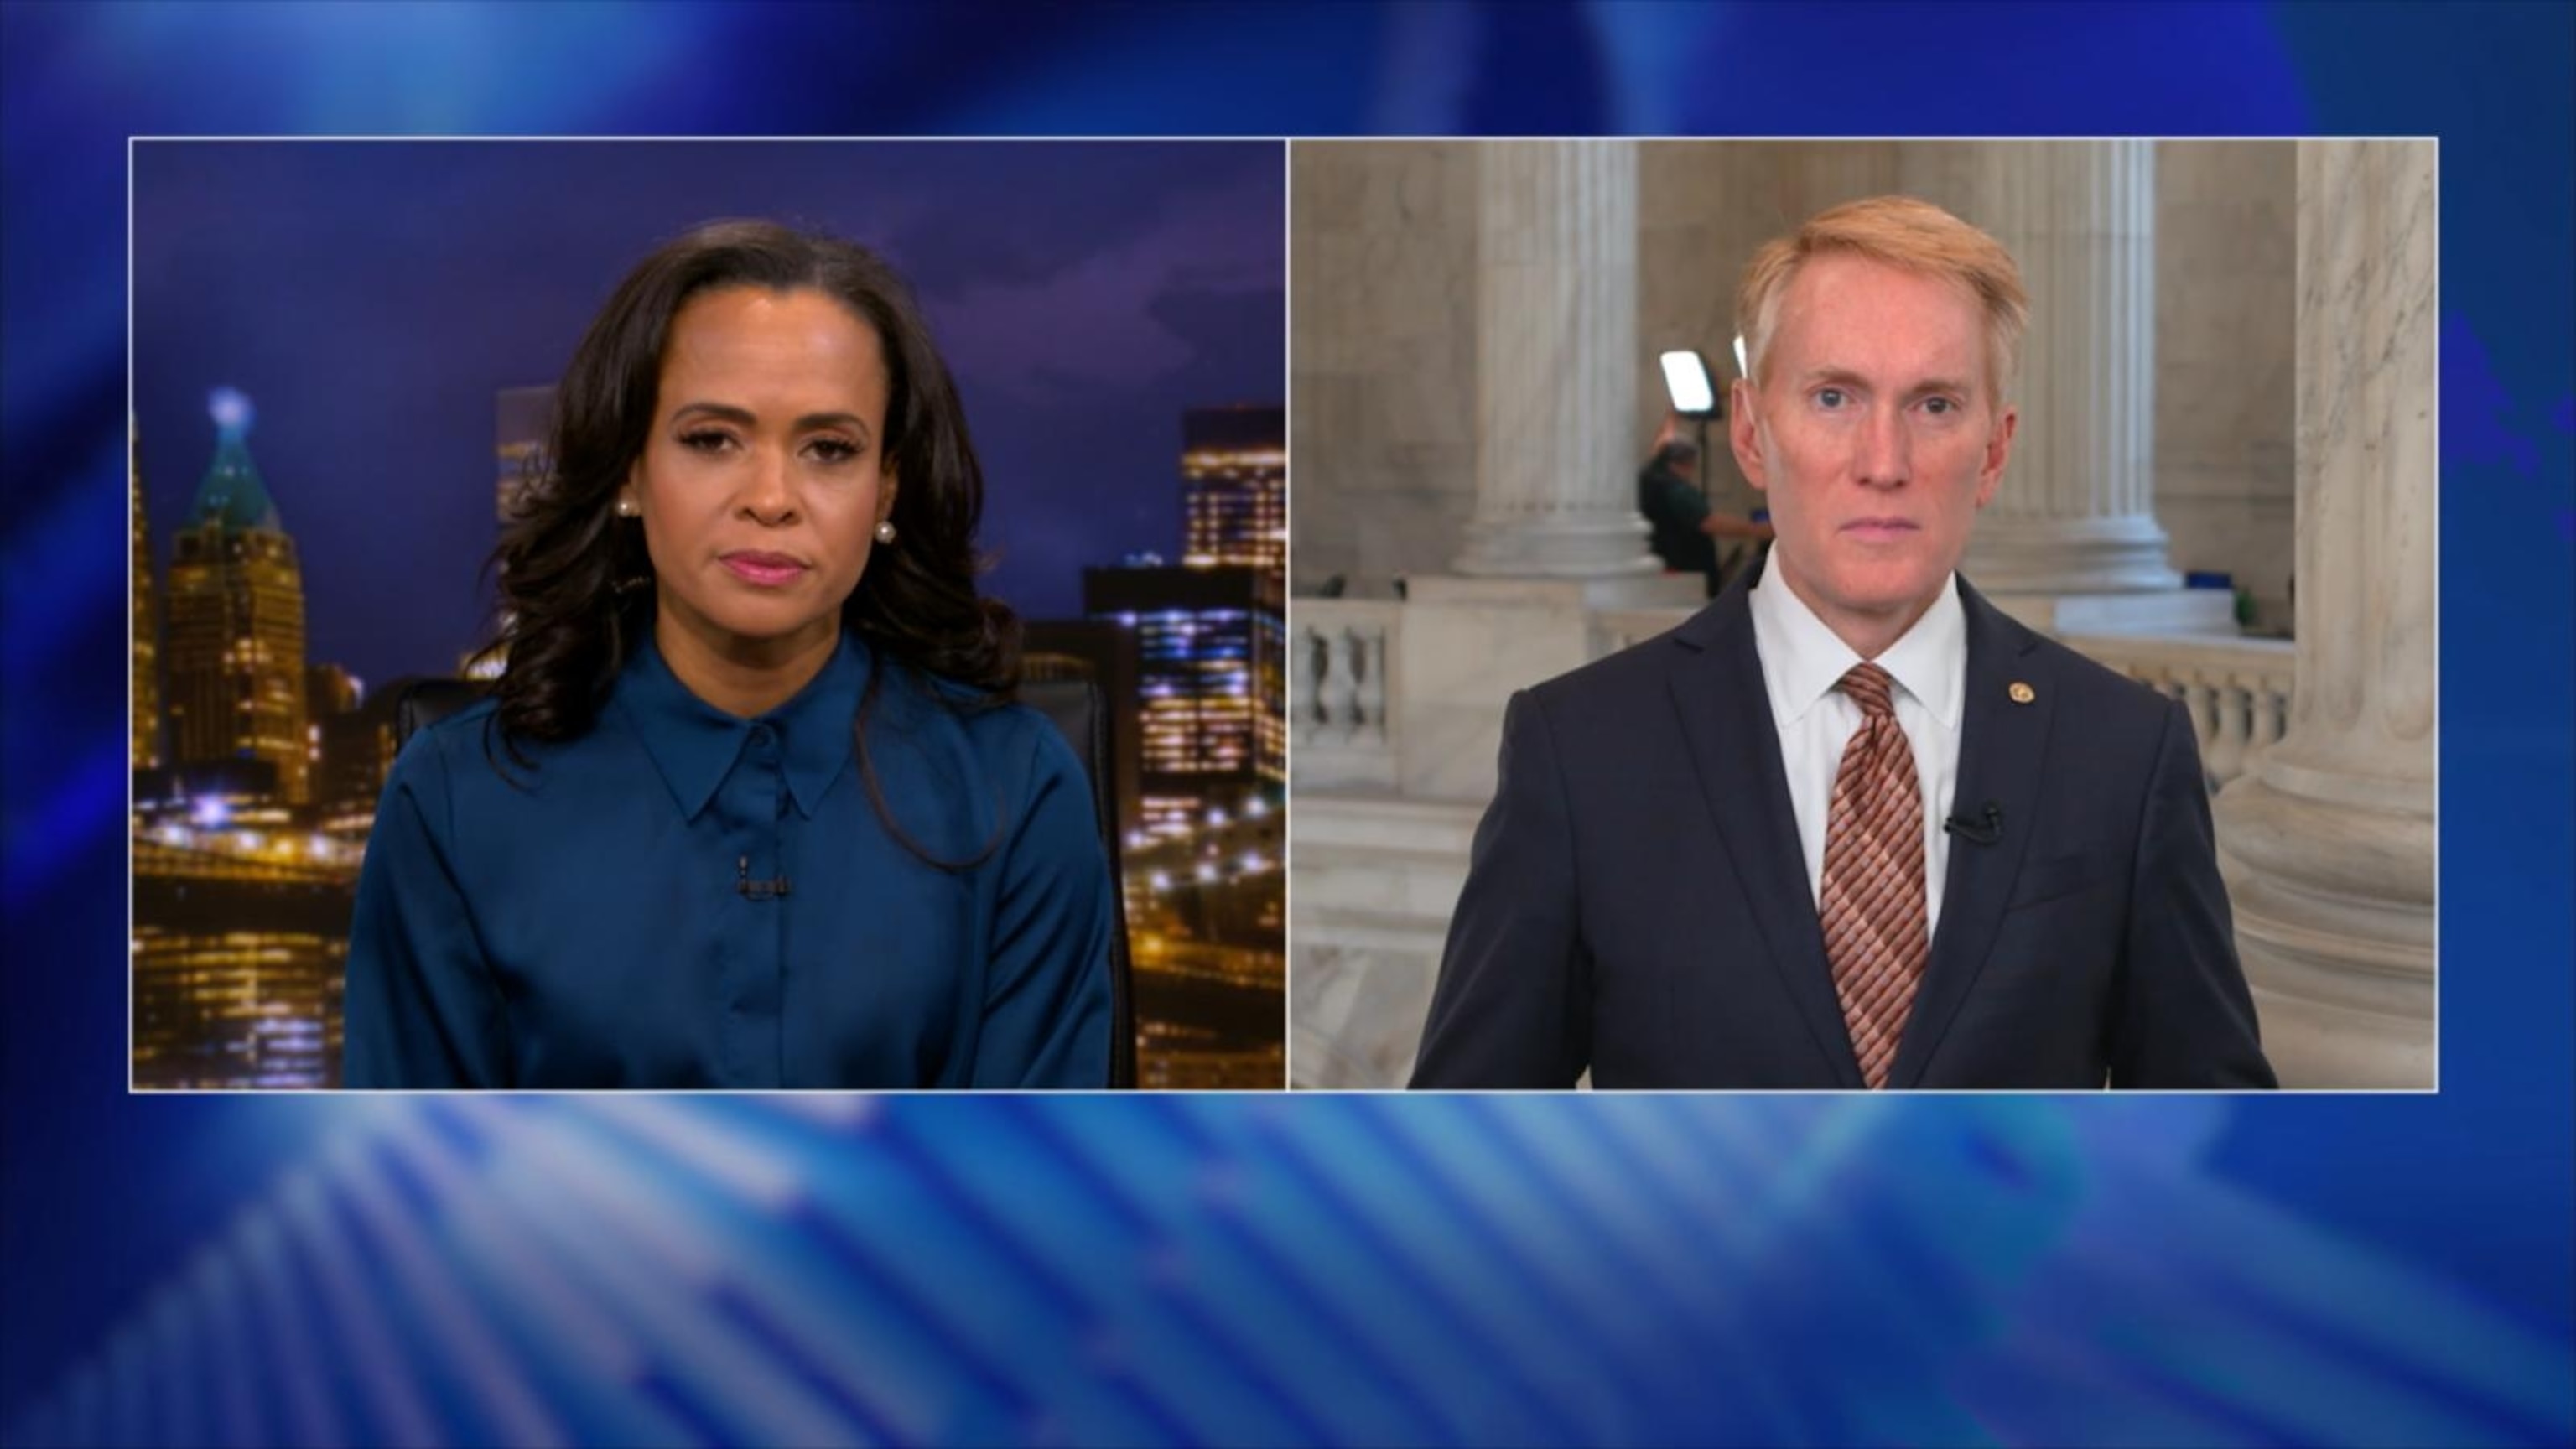
Sen. James Lankford on day 9 of the government shutdown
- 12 hours ago

8:03
Tensions escalate on Capitol Hill as Senate fails to pass government funding plan
- 19 hours ago
5:11
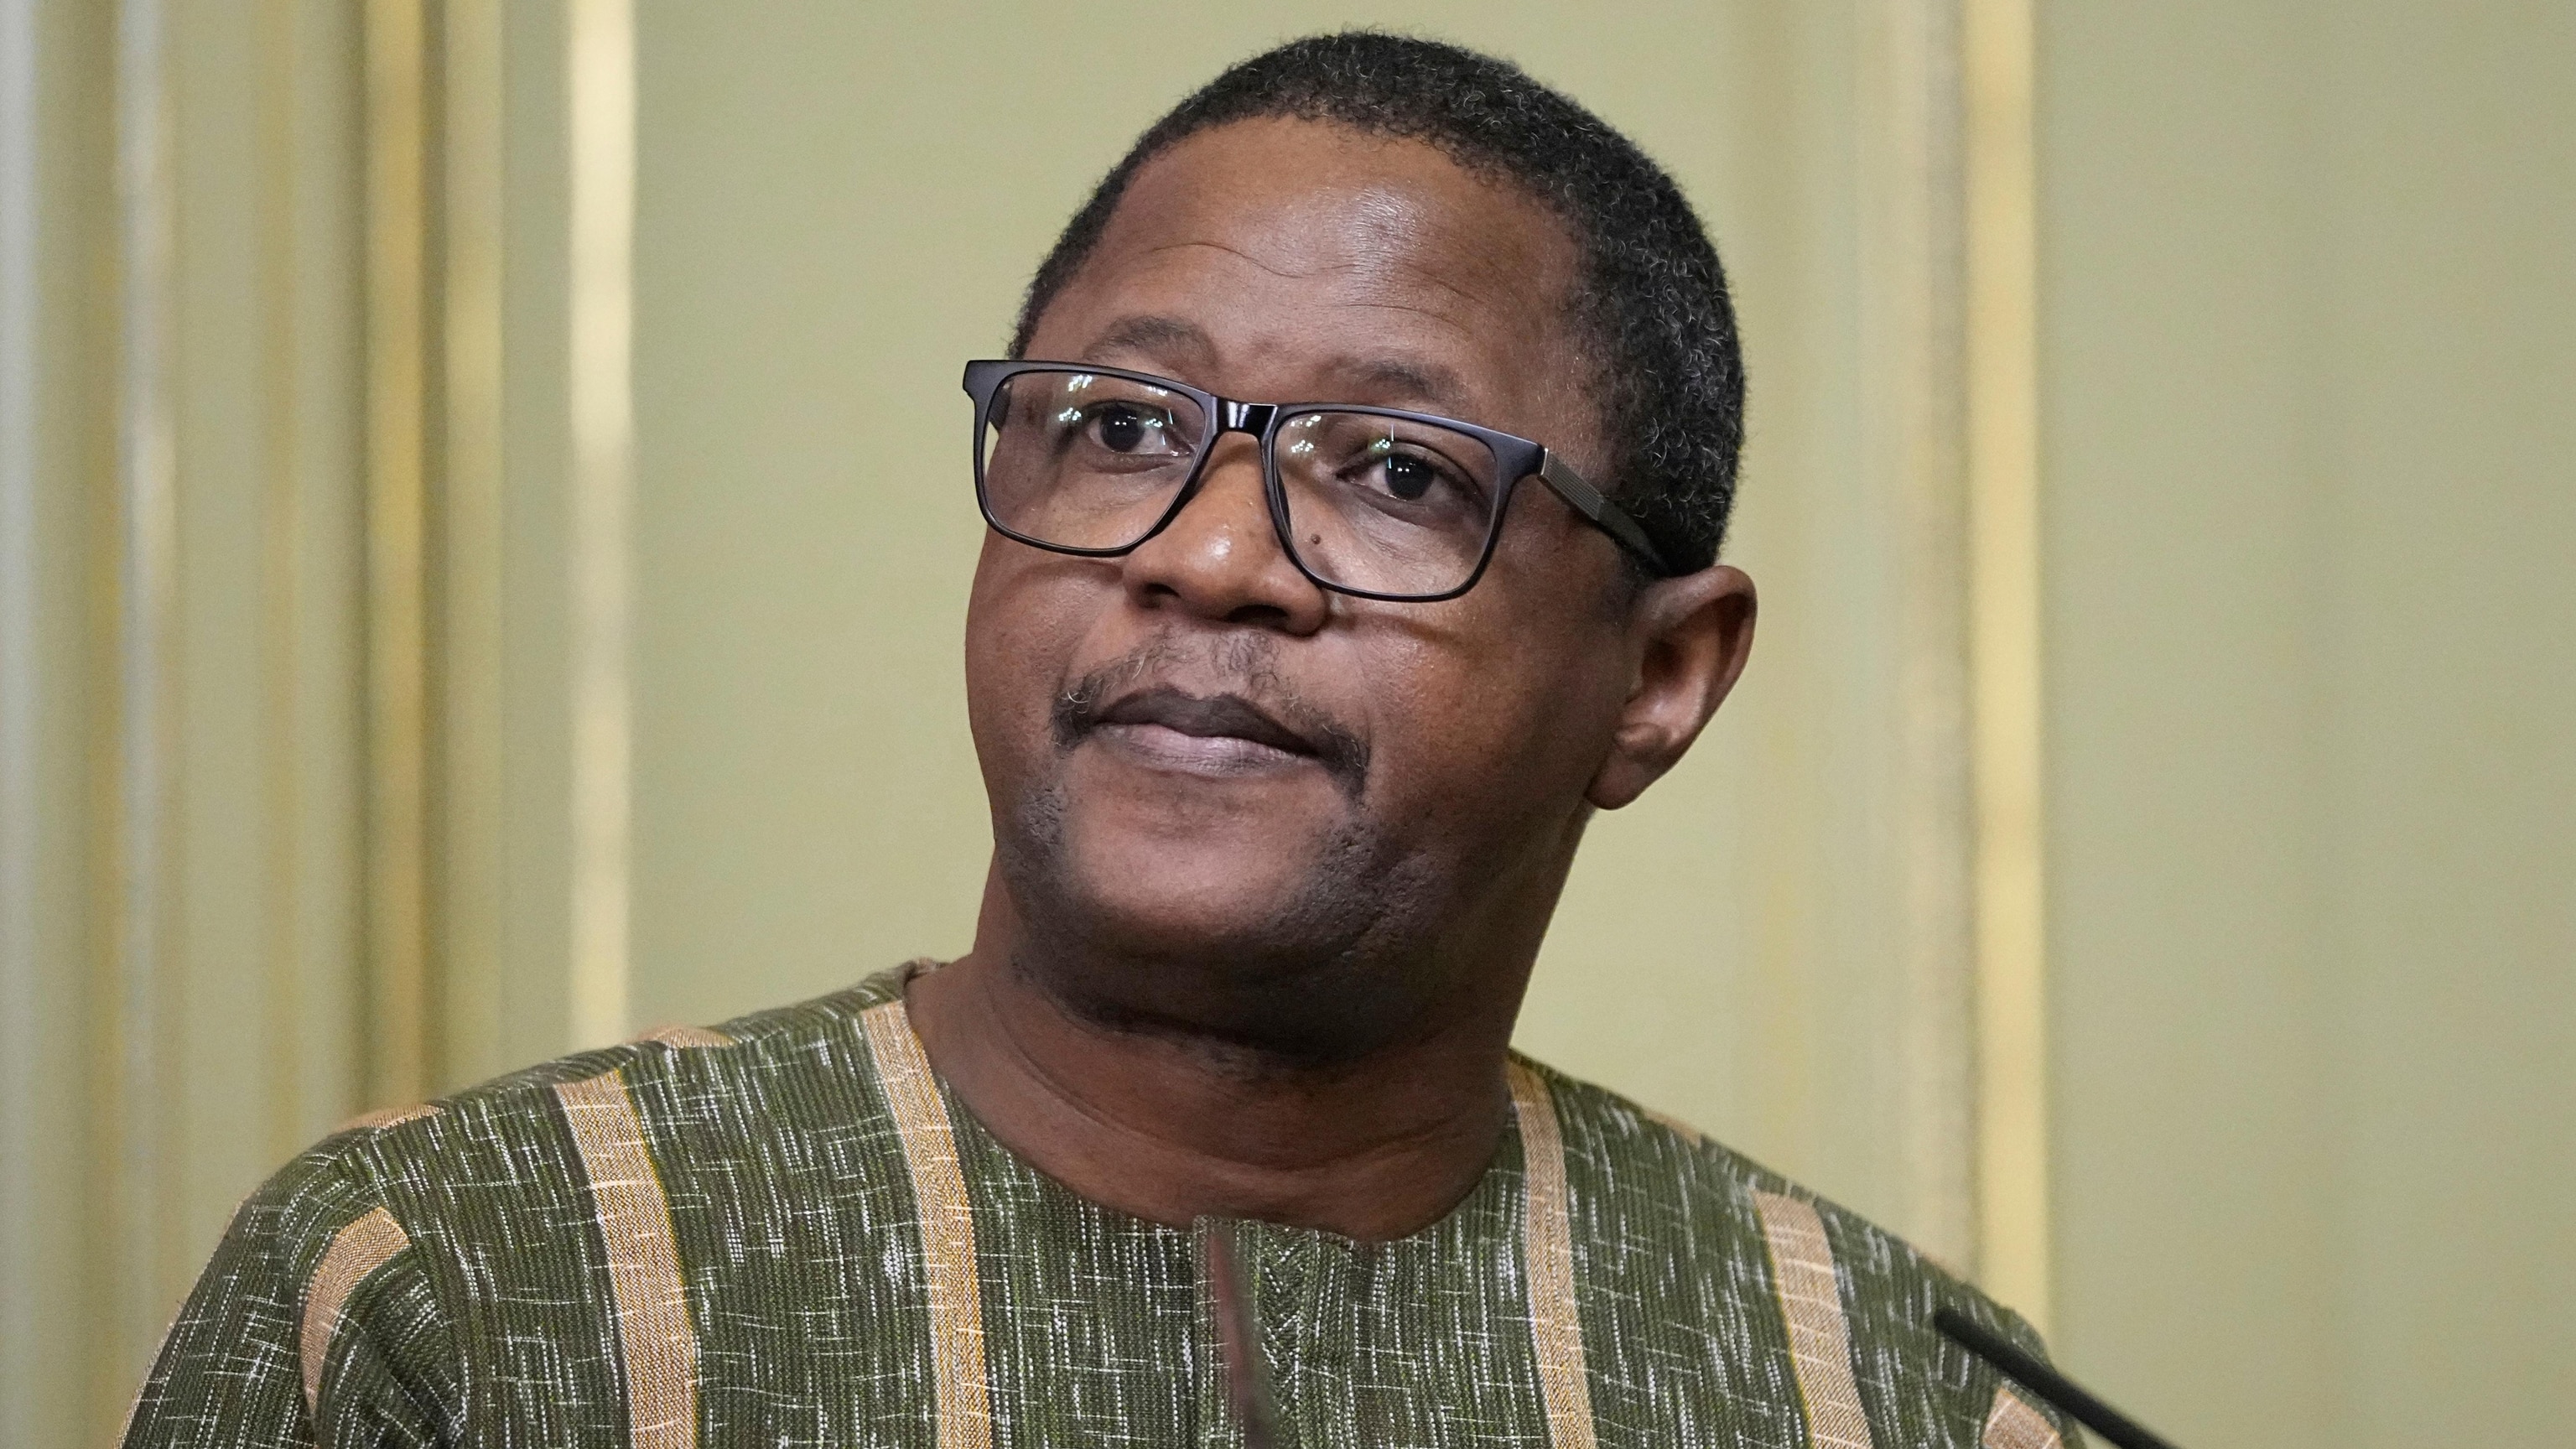
Former US ambassador shares doubts on Trump’s Gaza ceasefire plan
- 21 hours ago
6:46
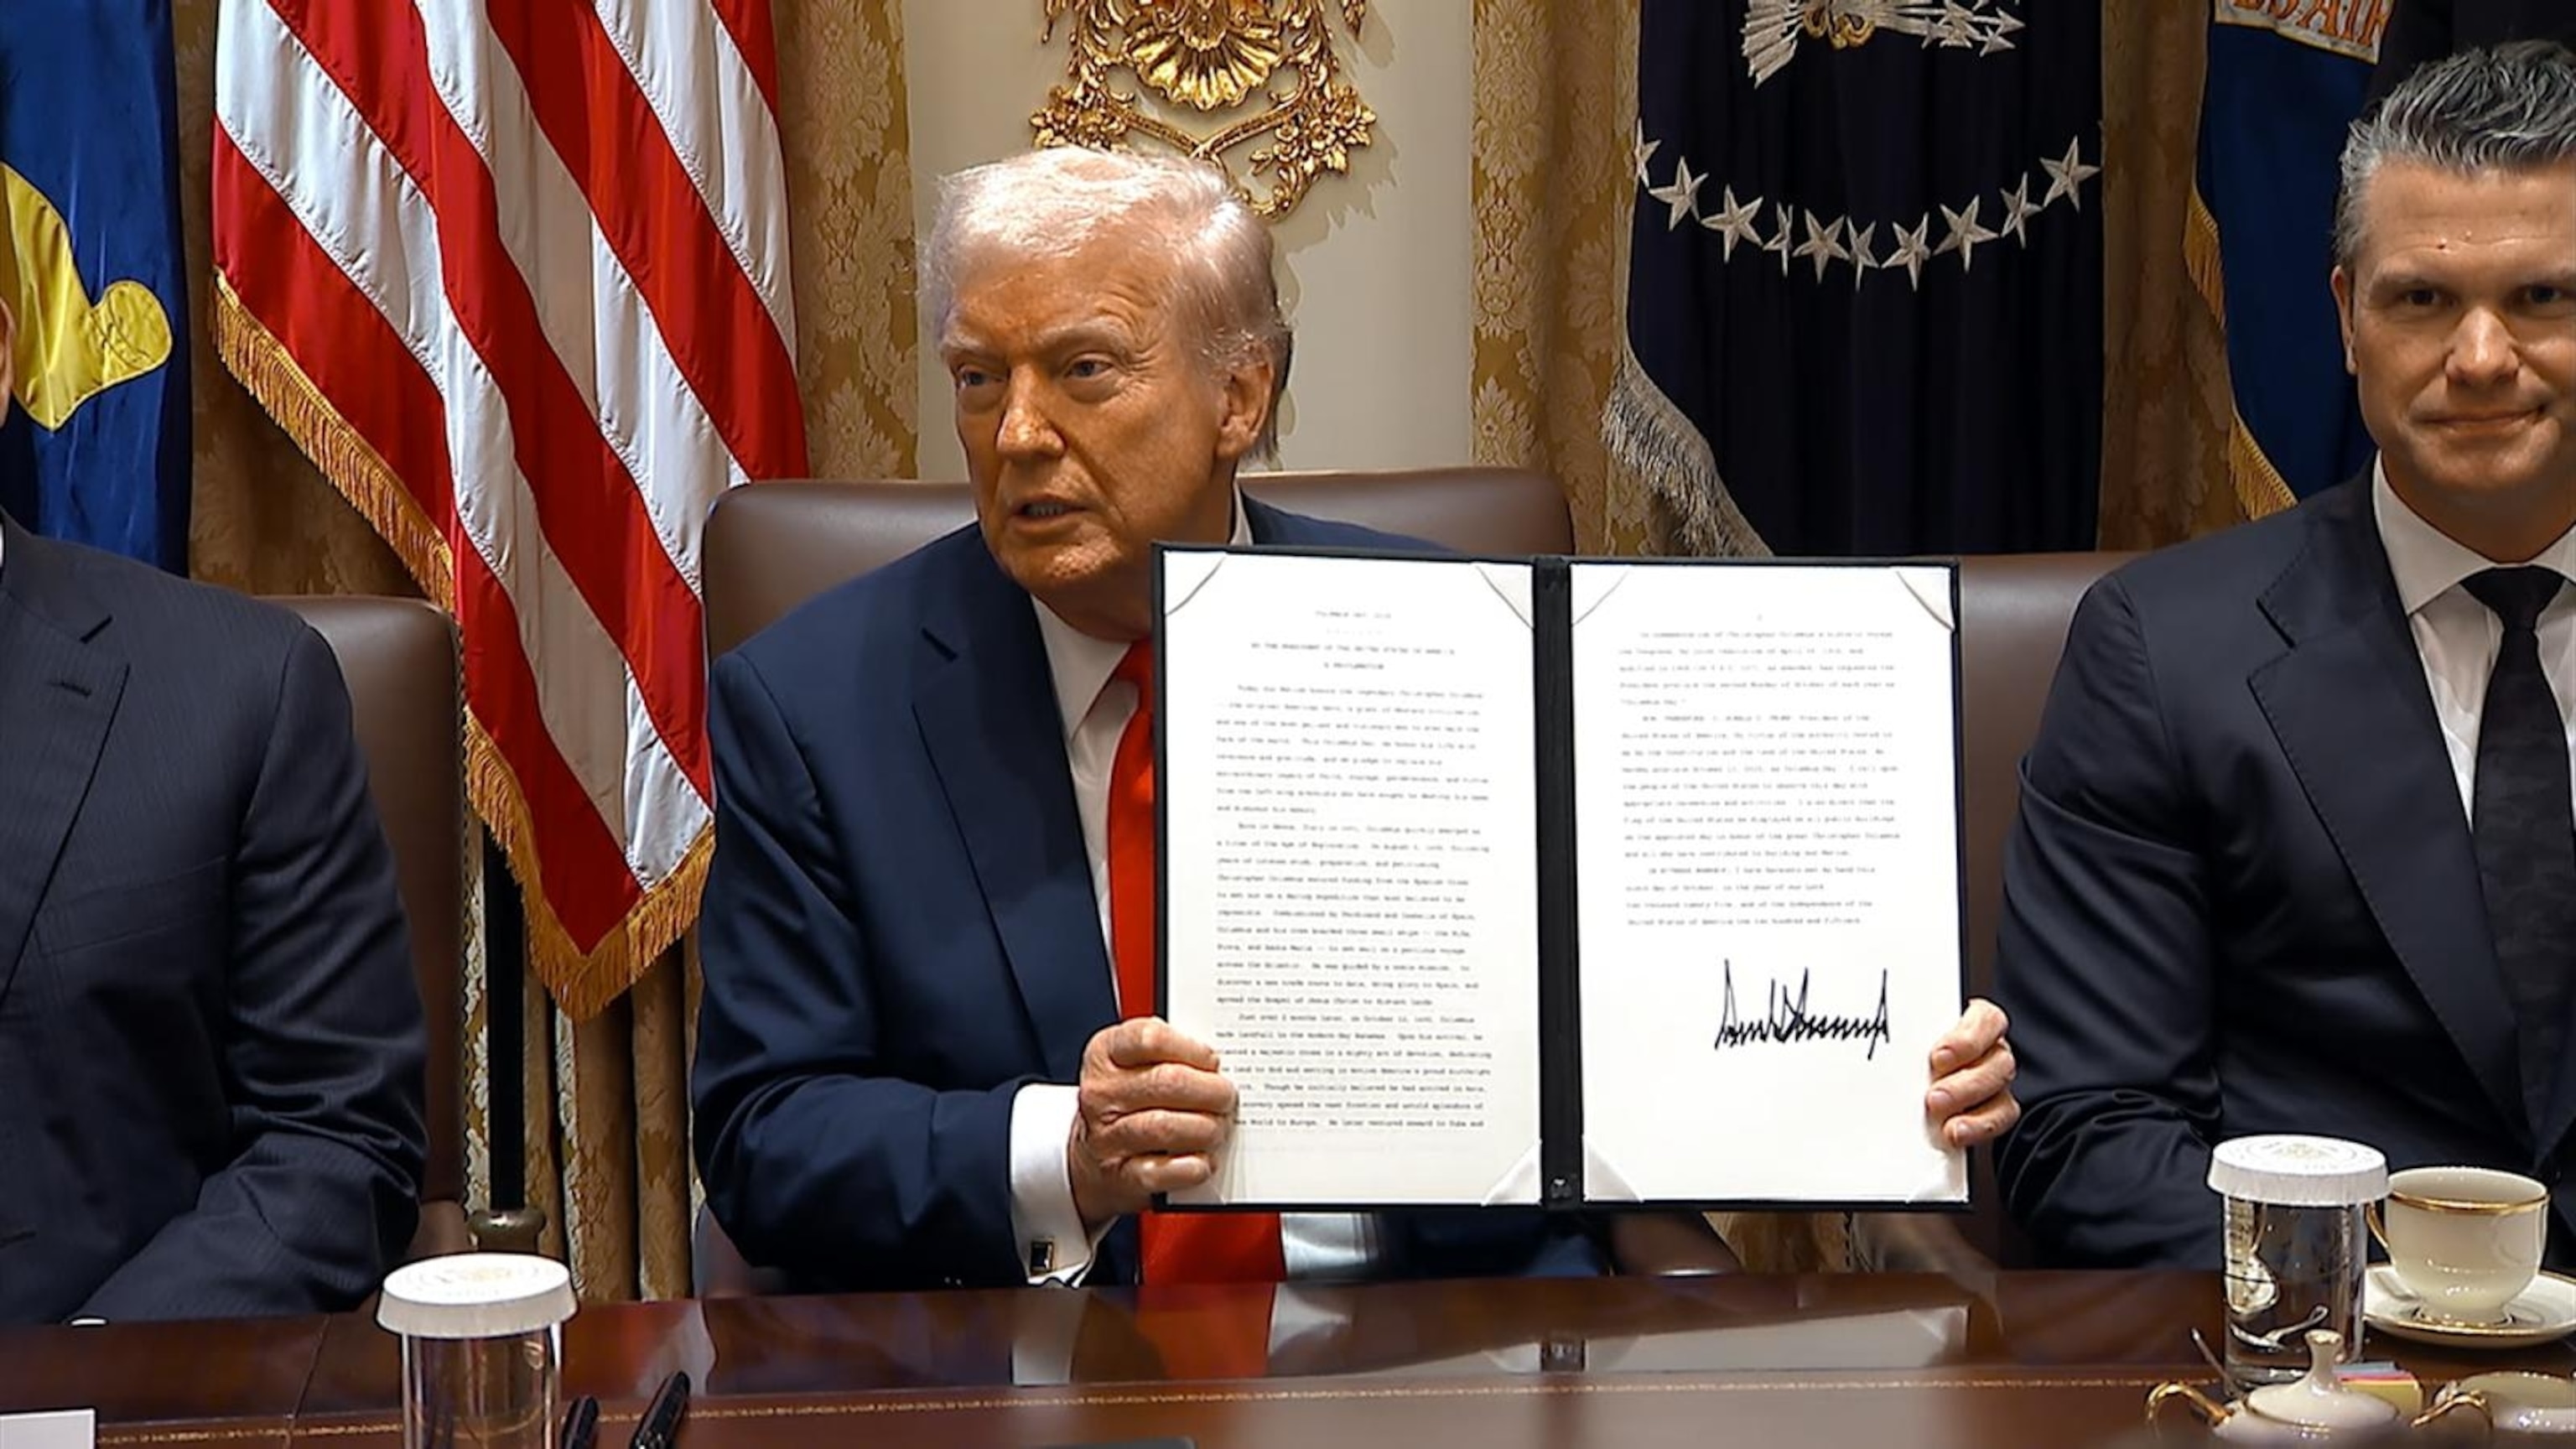
Trump says there will be 'everlasting peace' in the Middle East
- 1 day ago
2:10
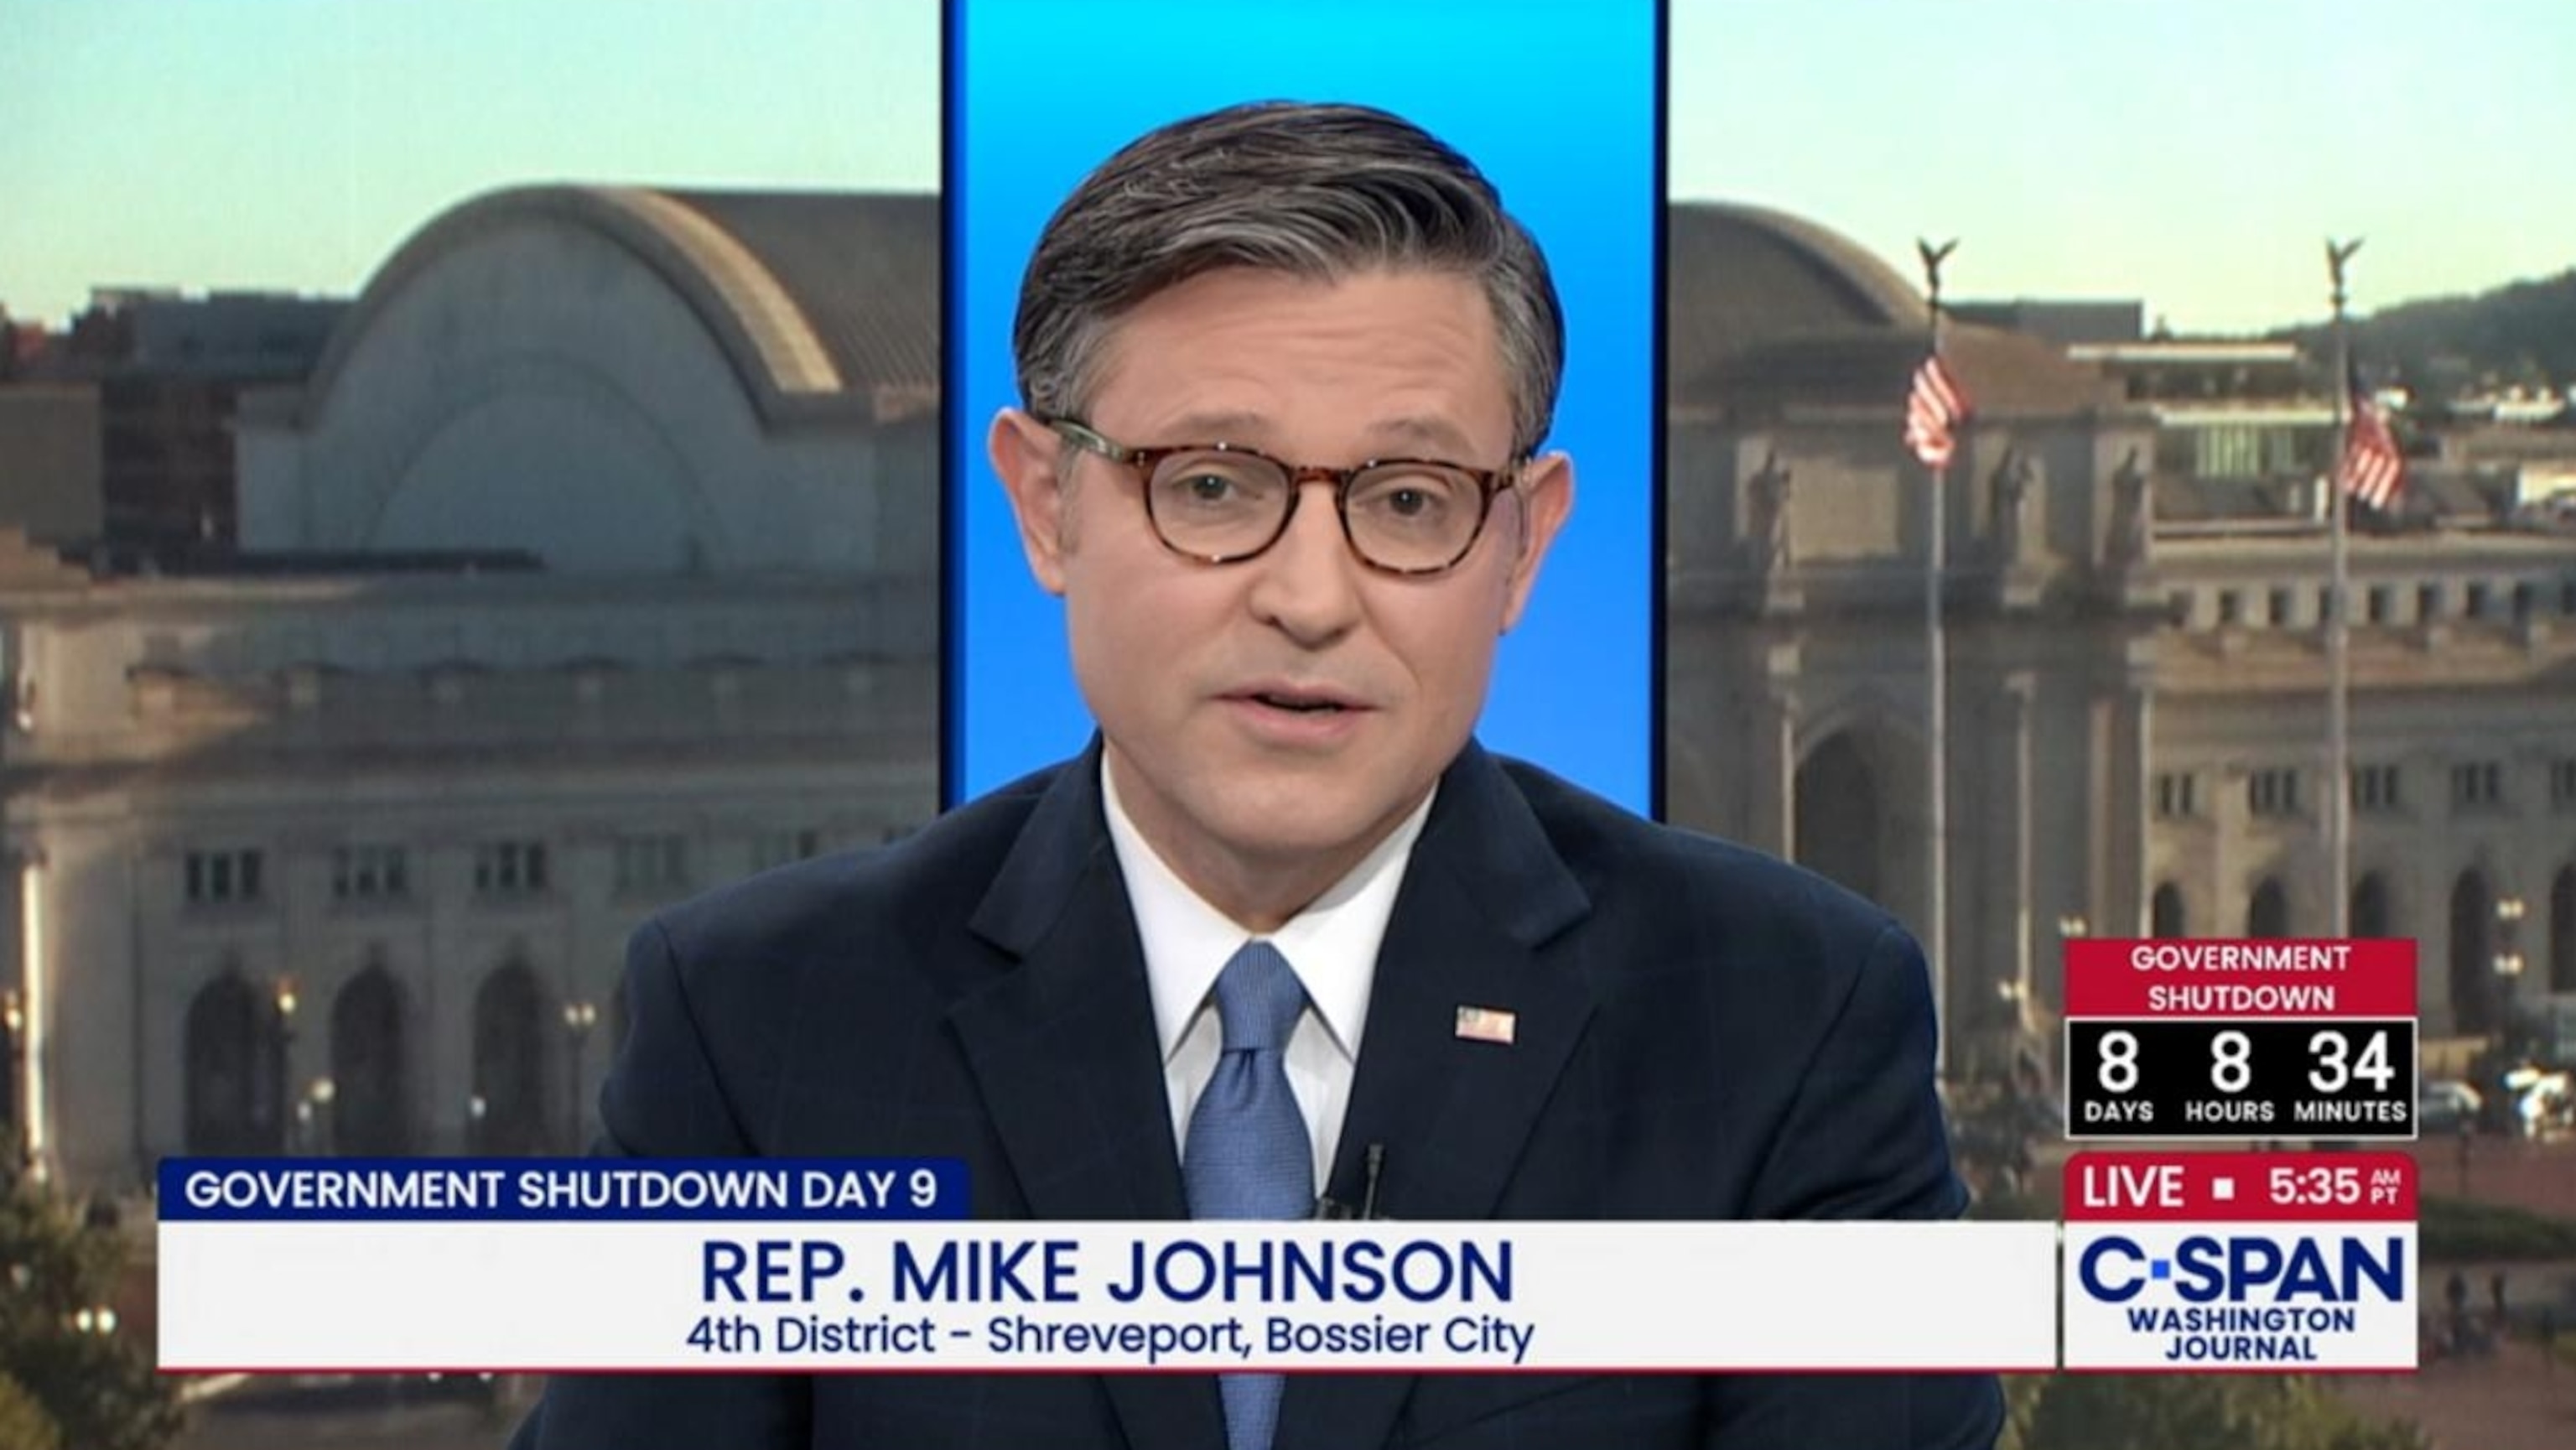
'My kids could die': Mom begs Johnson to pass bill to pay troops during shutdown
- 1 day ago
3:29
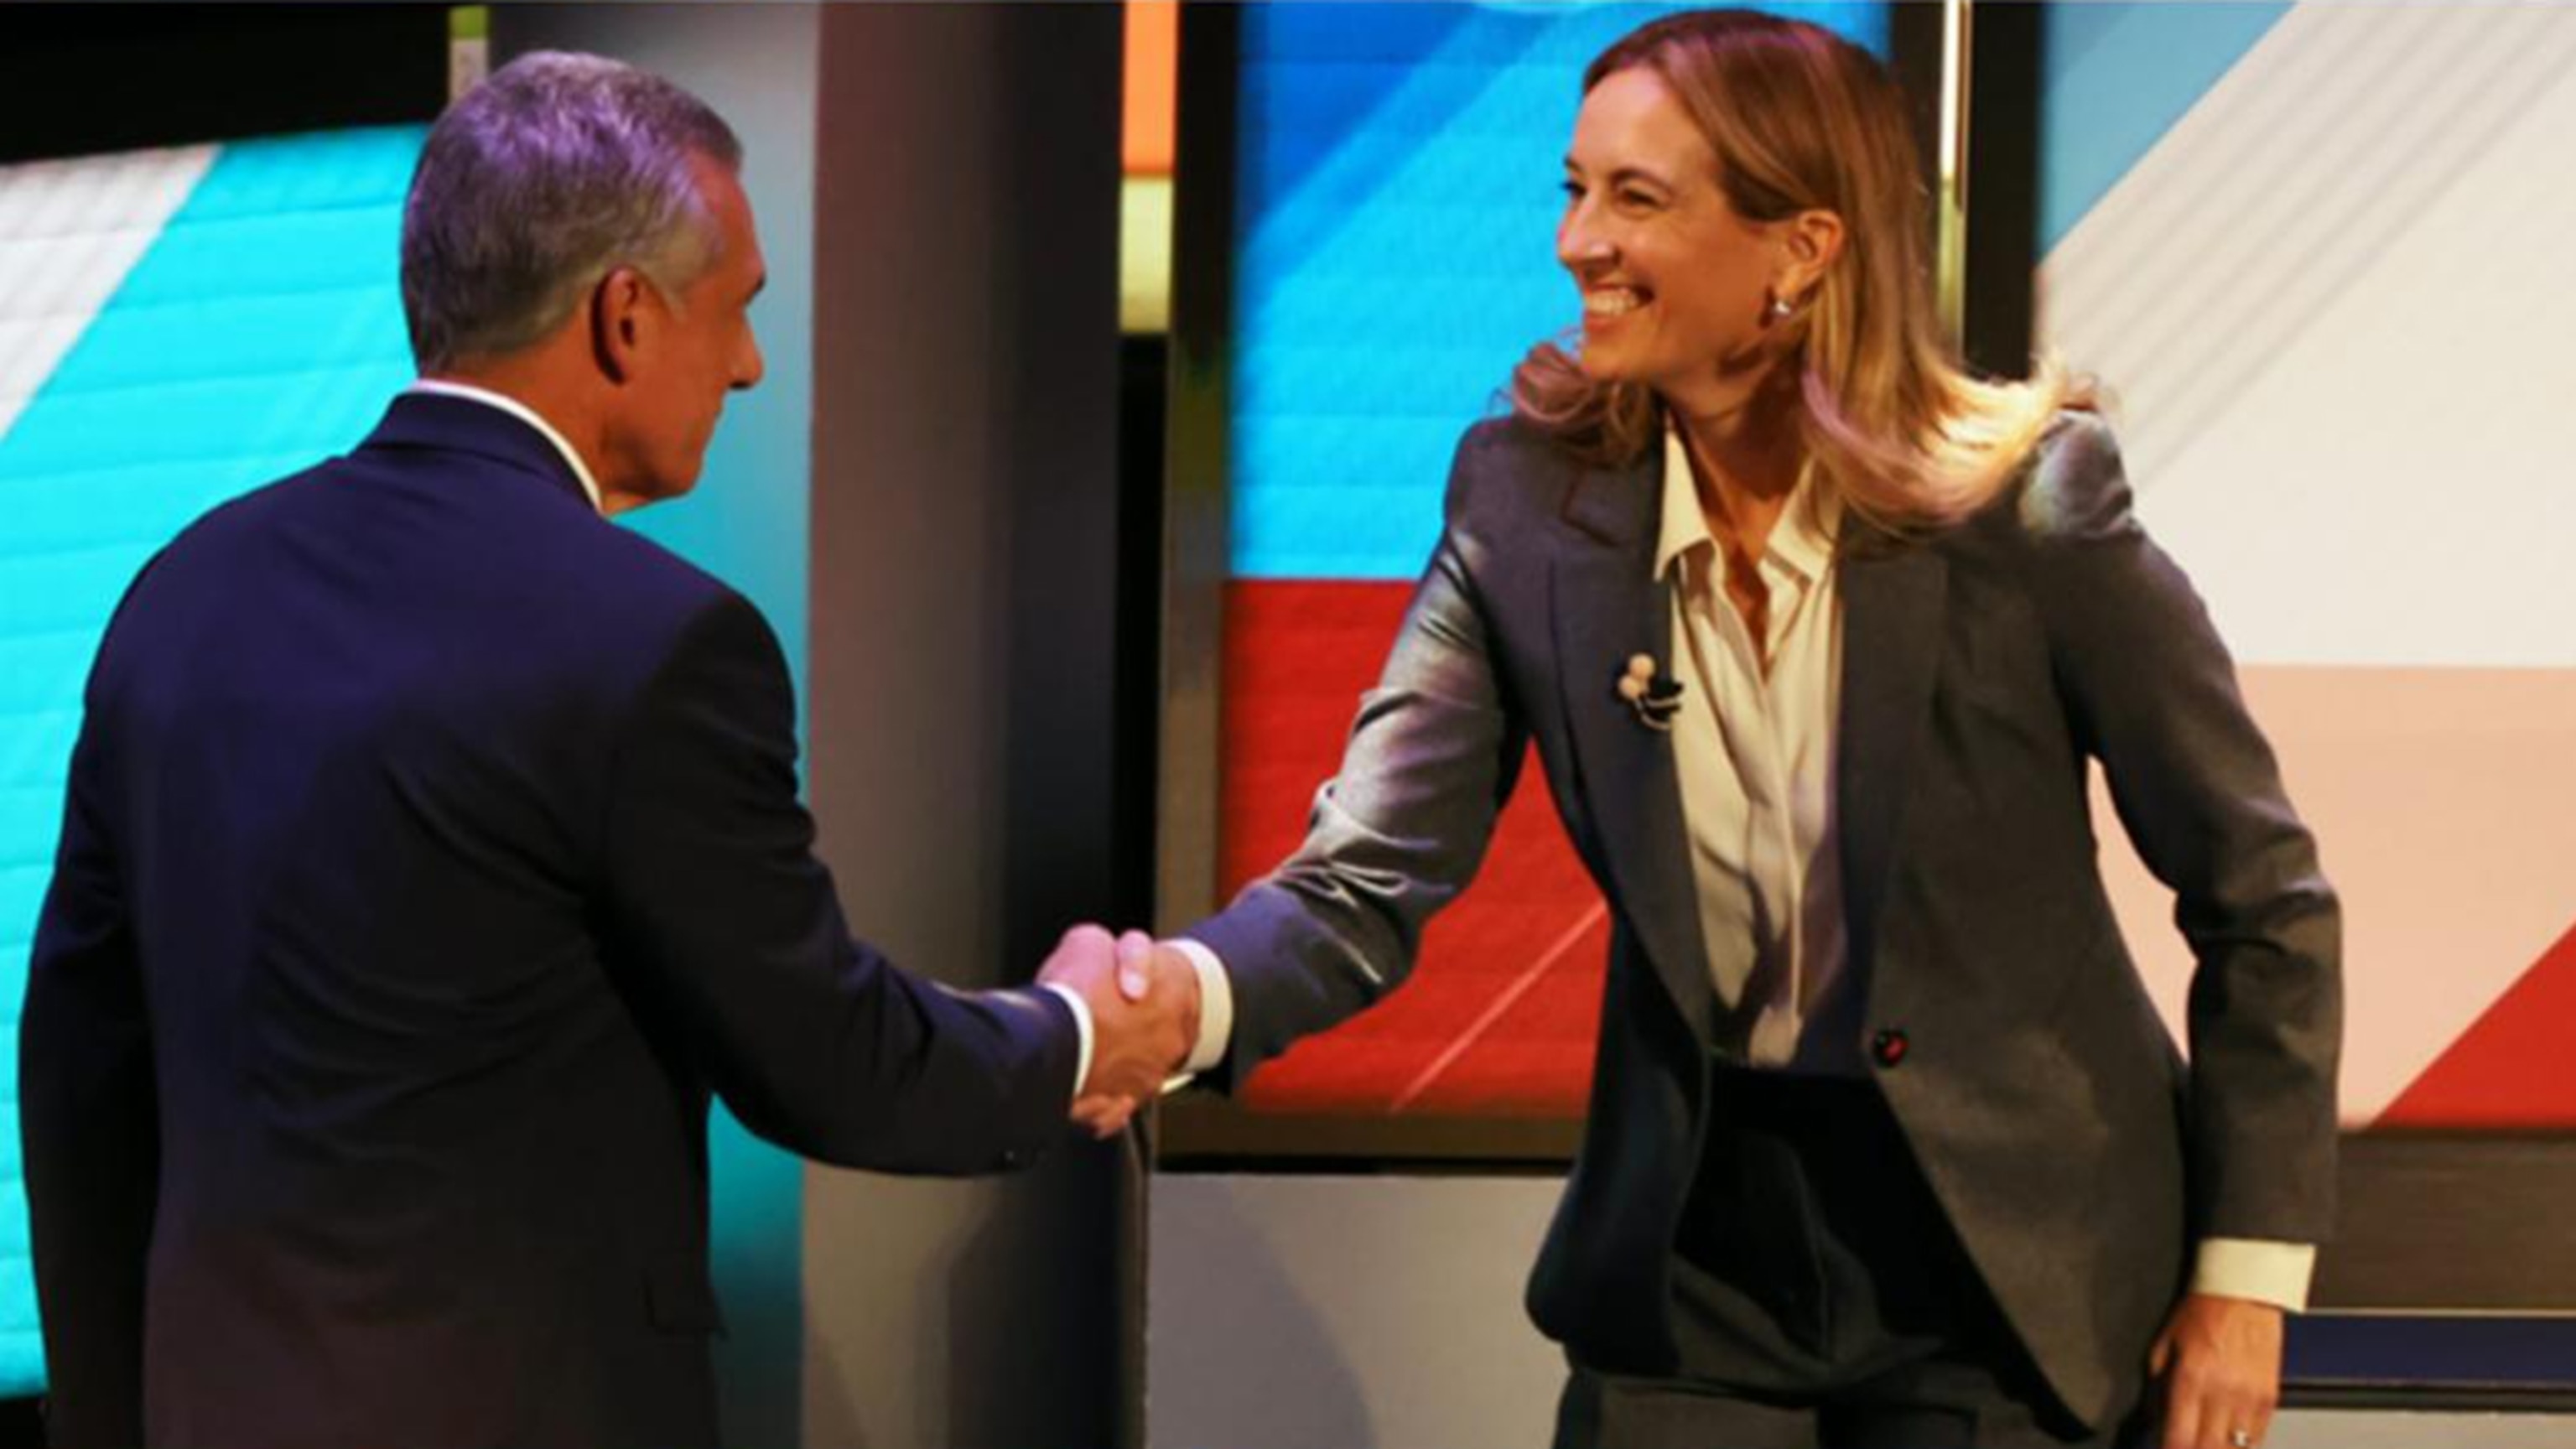
Tensions run high during final NJ governor debate
- 1 day ago
11:34
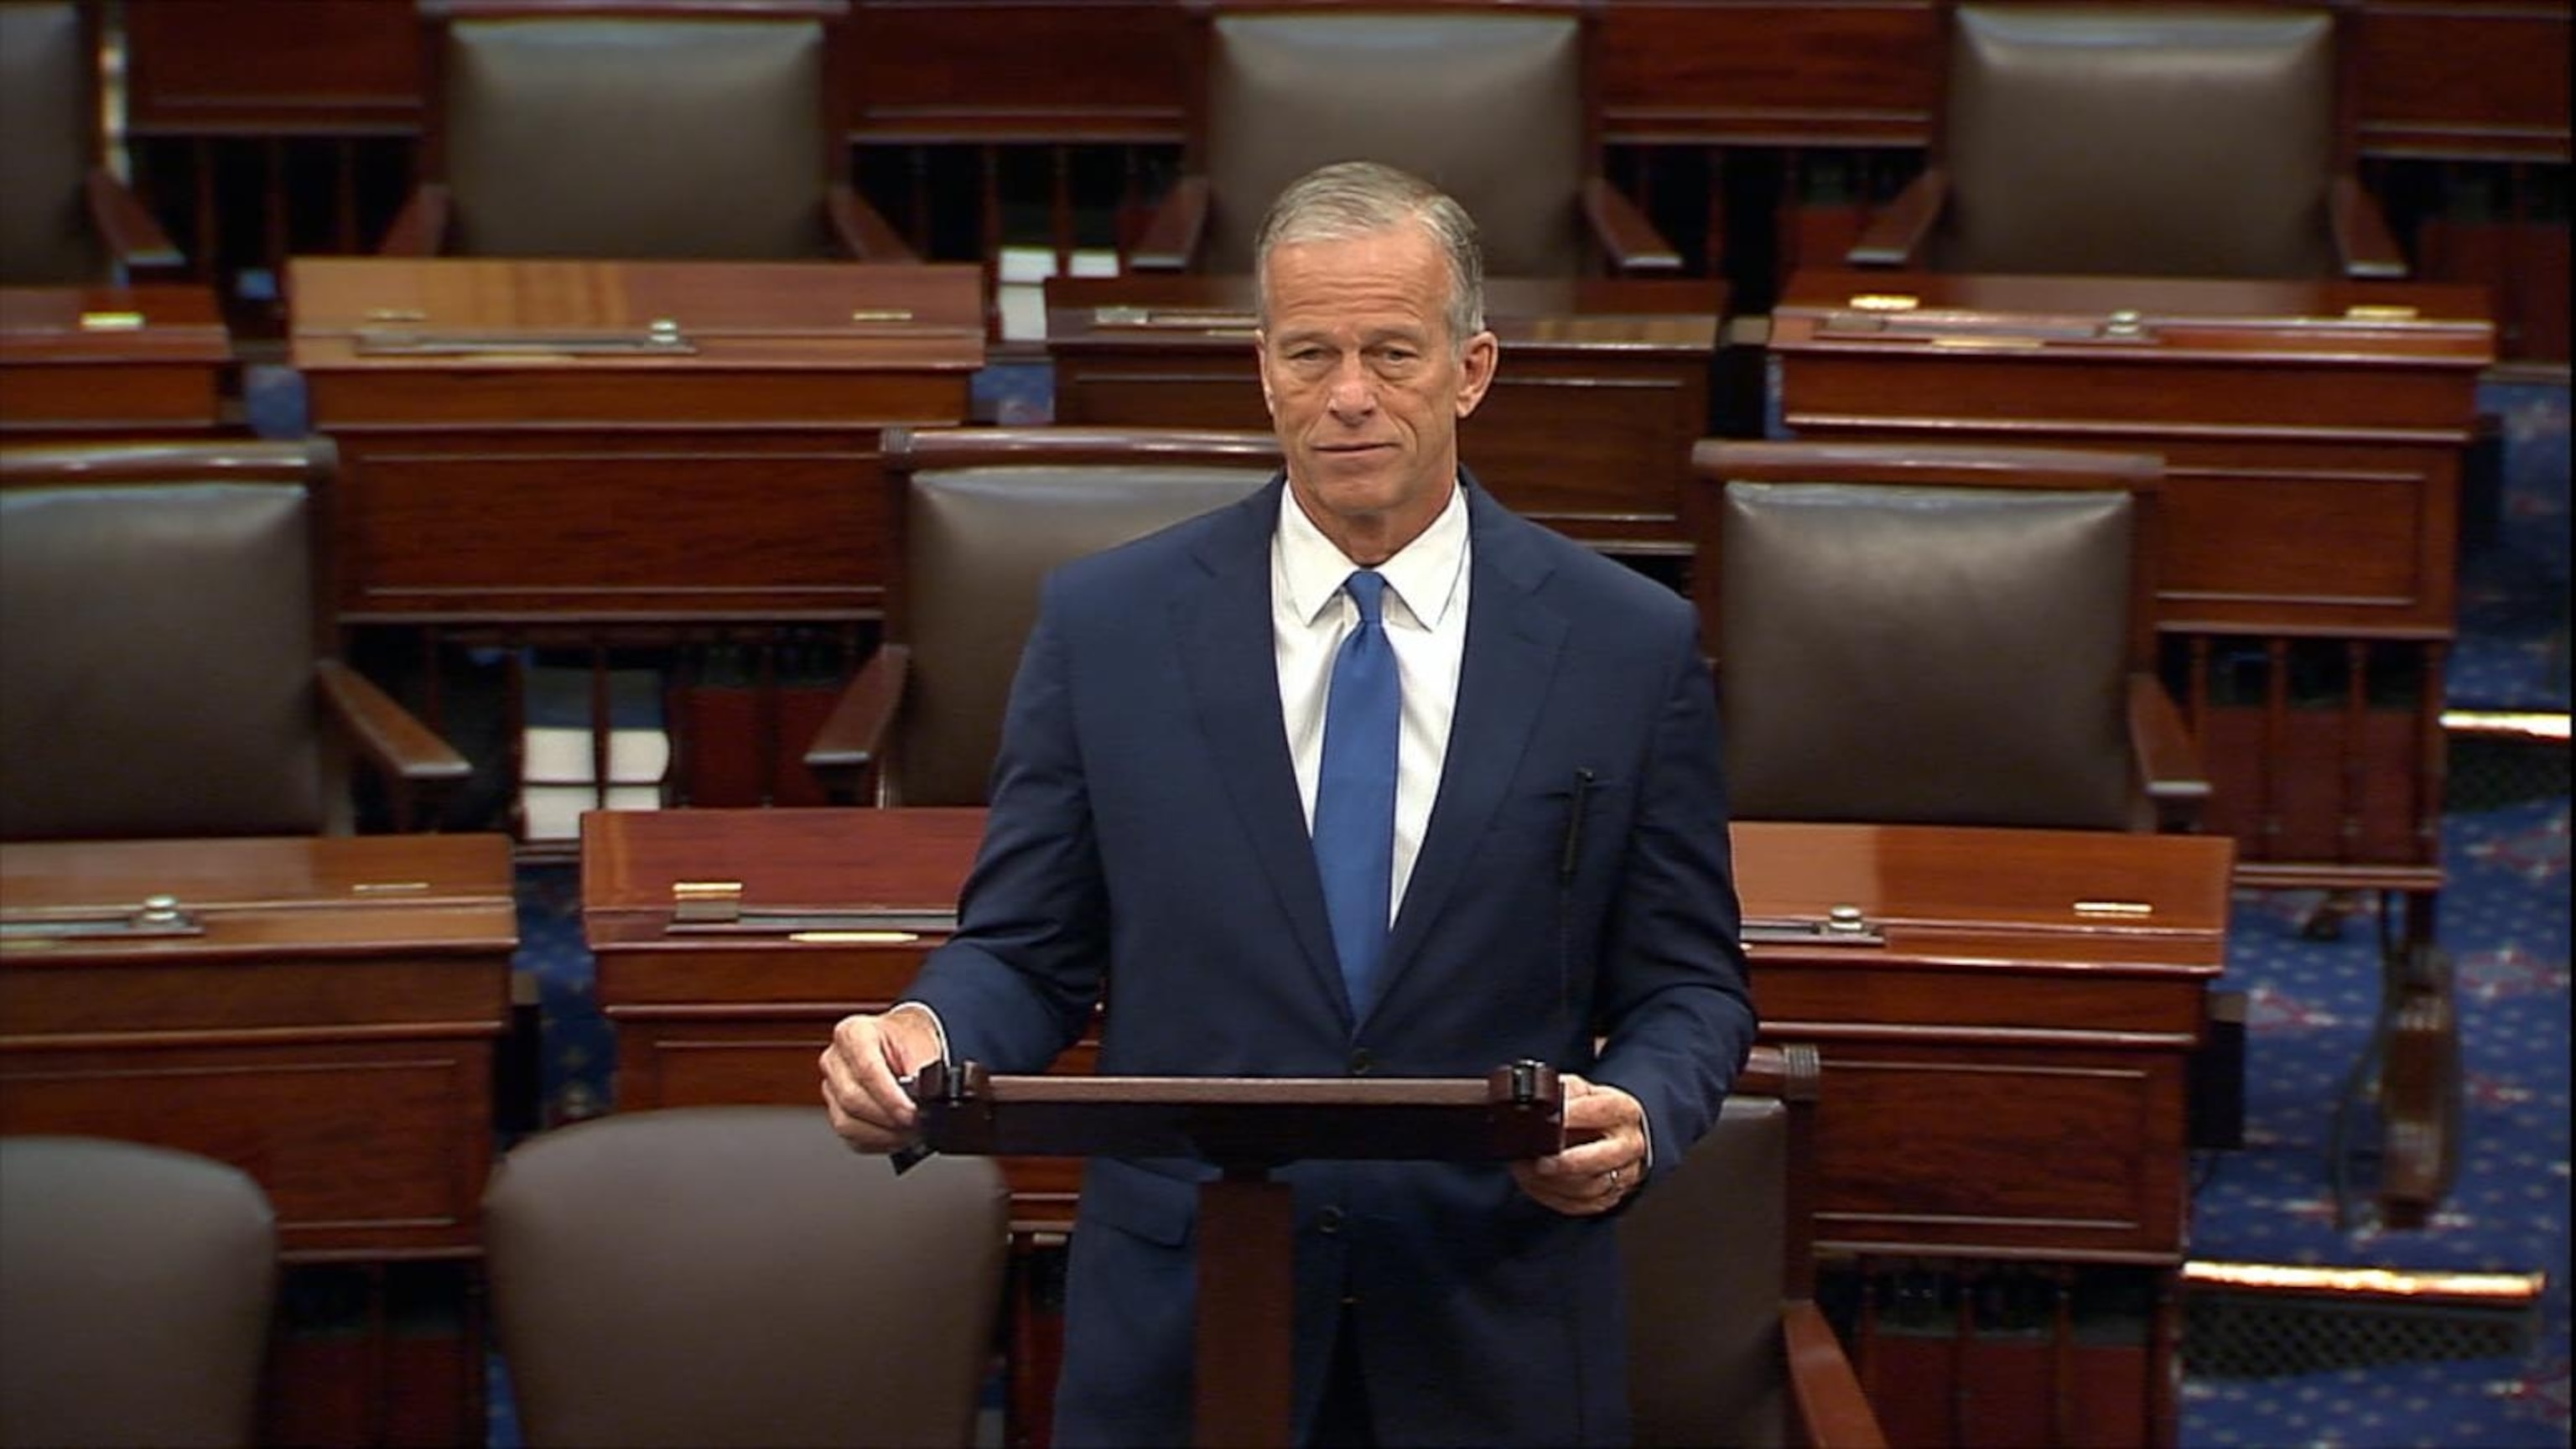
Senate Majority Leader John Thune on government shutdown
- 2 days ago

2:39
White House says it plans to use tariff revenue to run WIC nutrition program
- 2 days ago
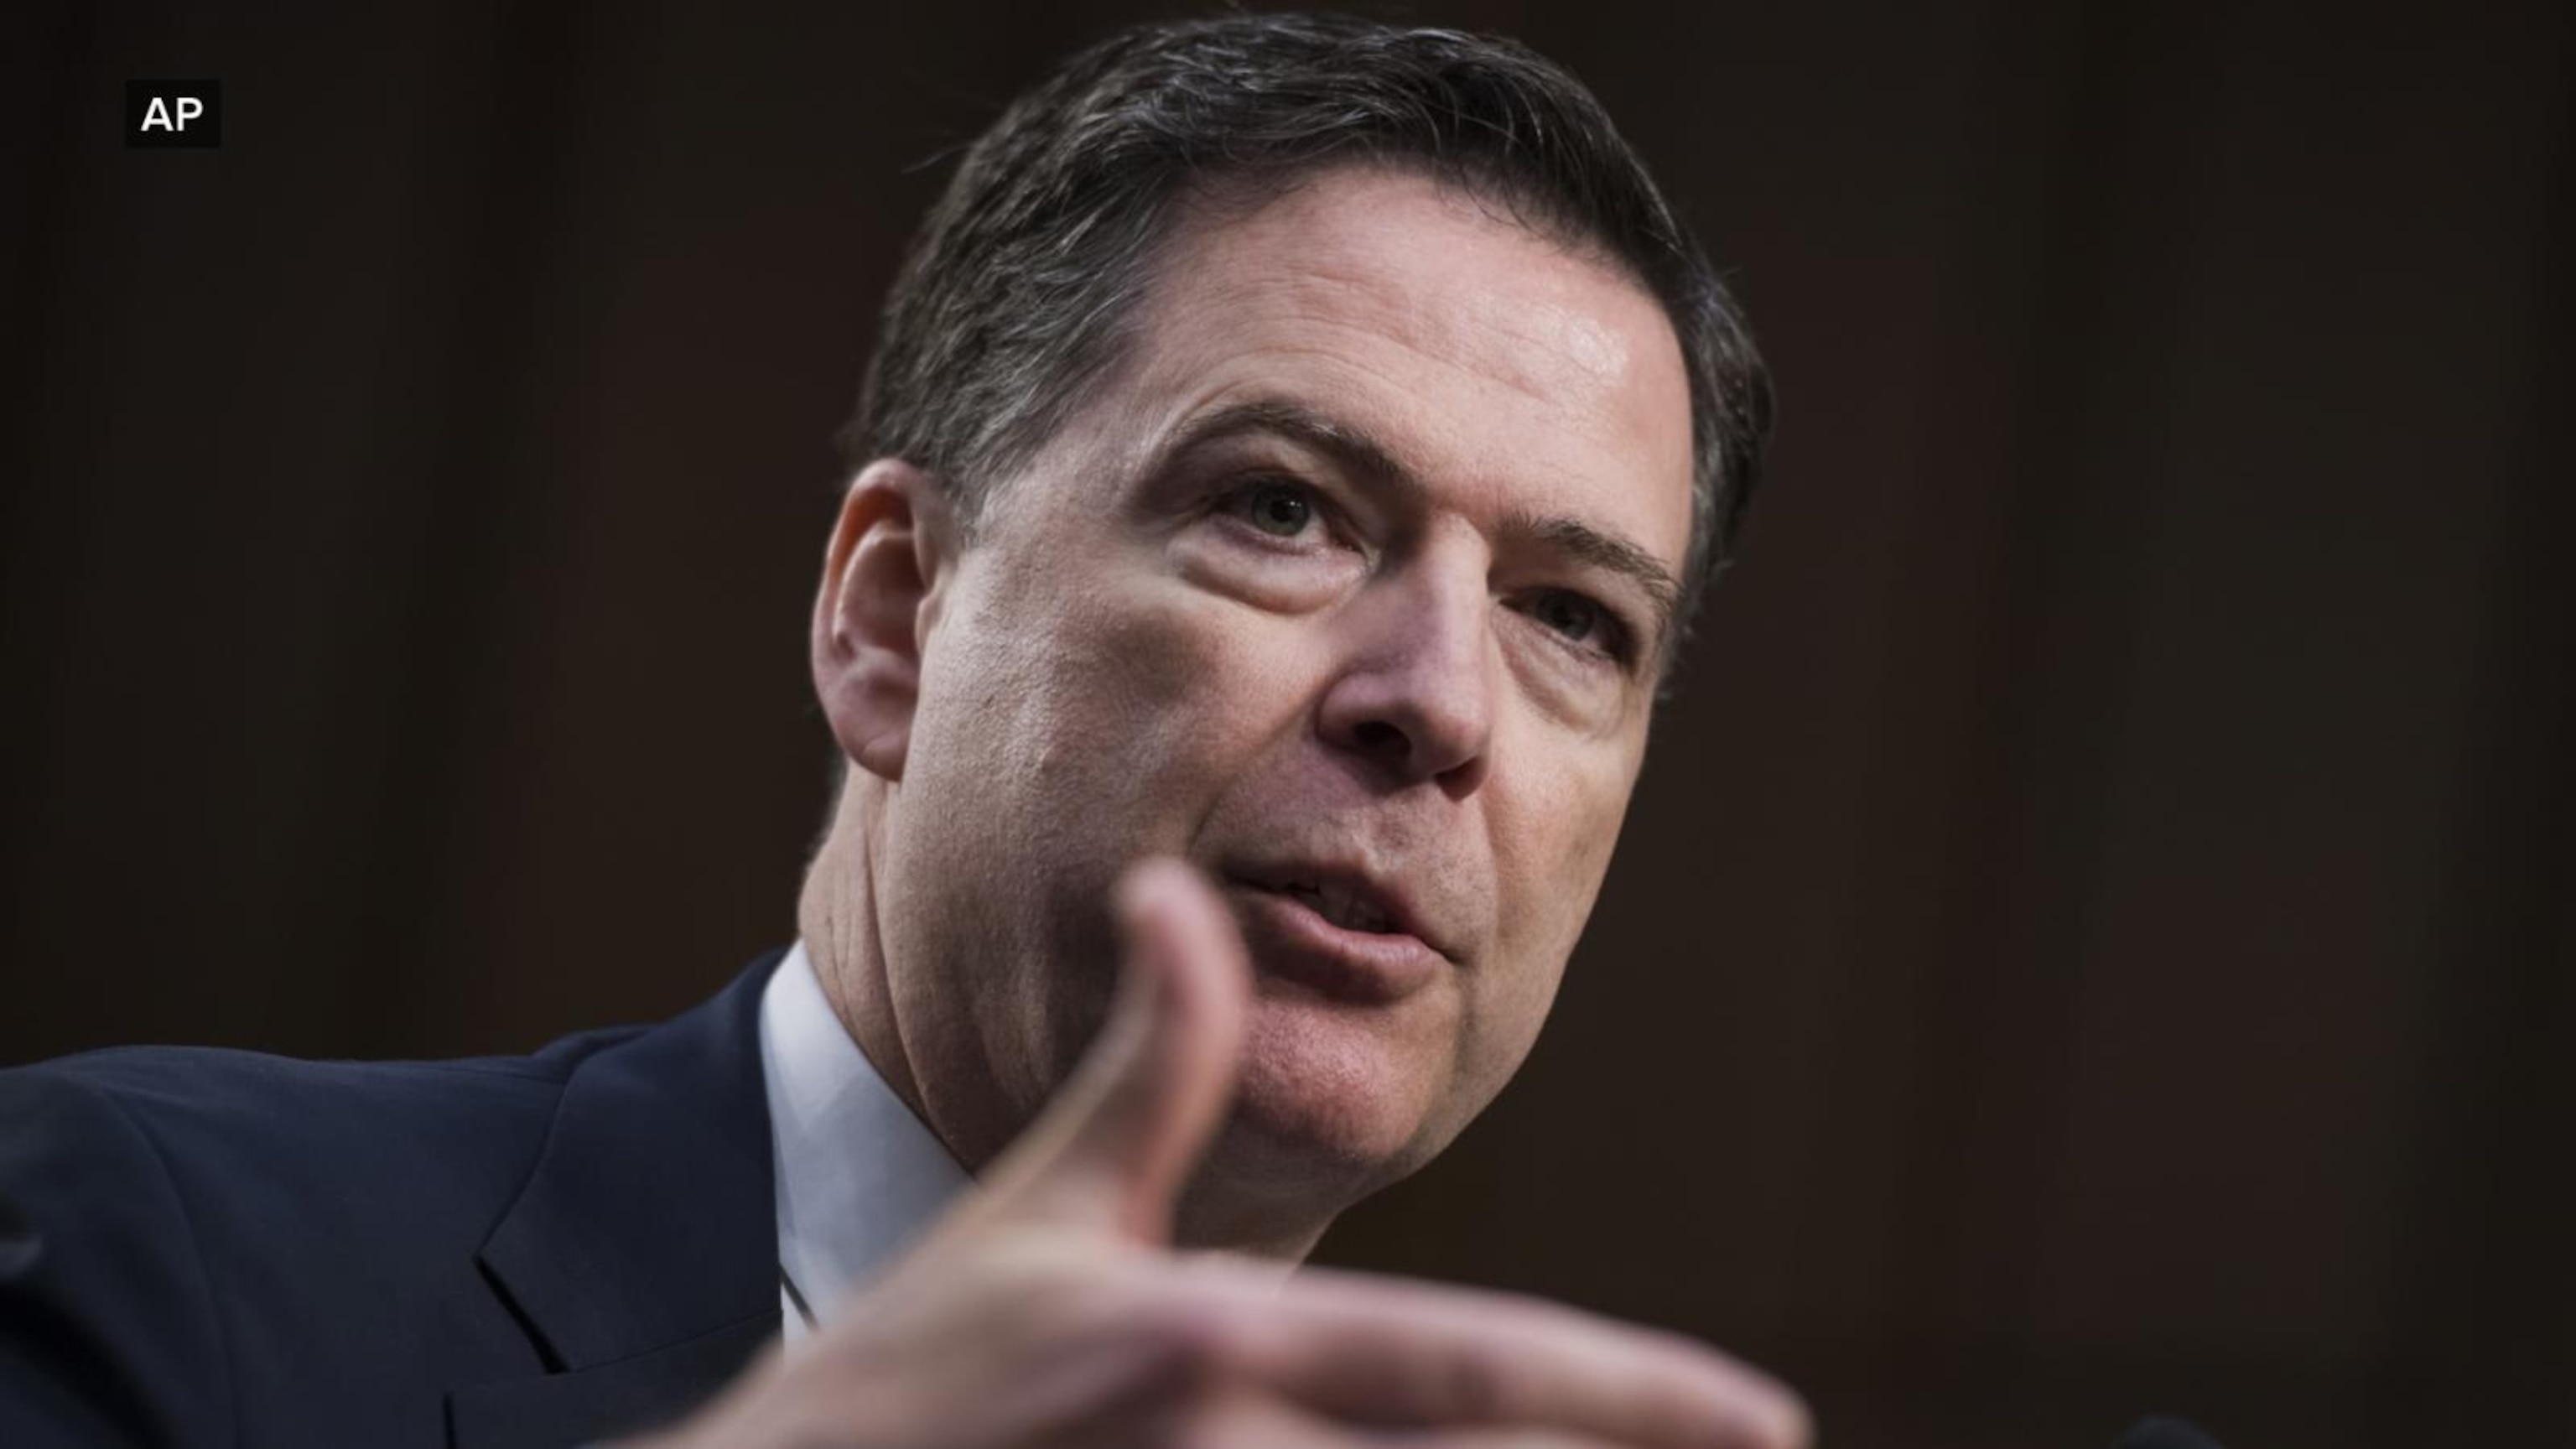
4:46
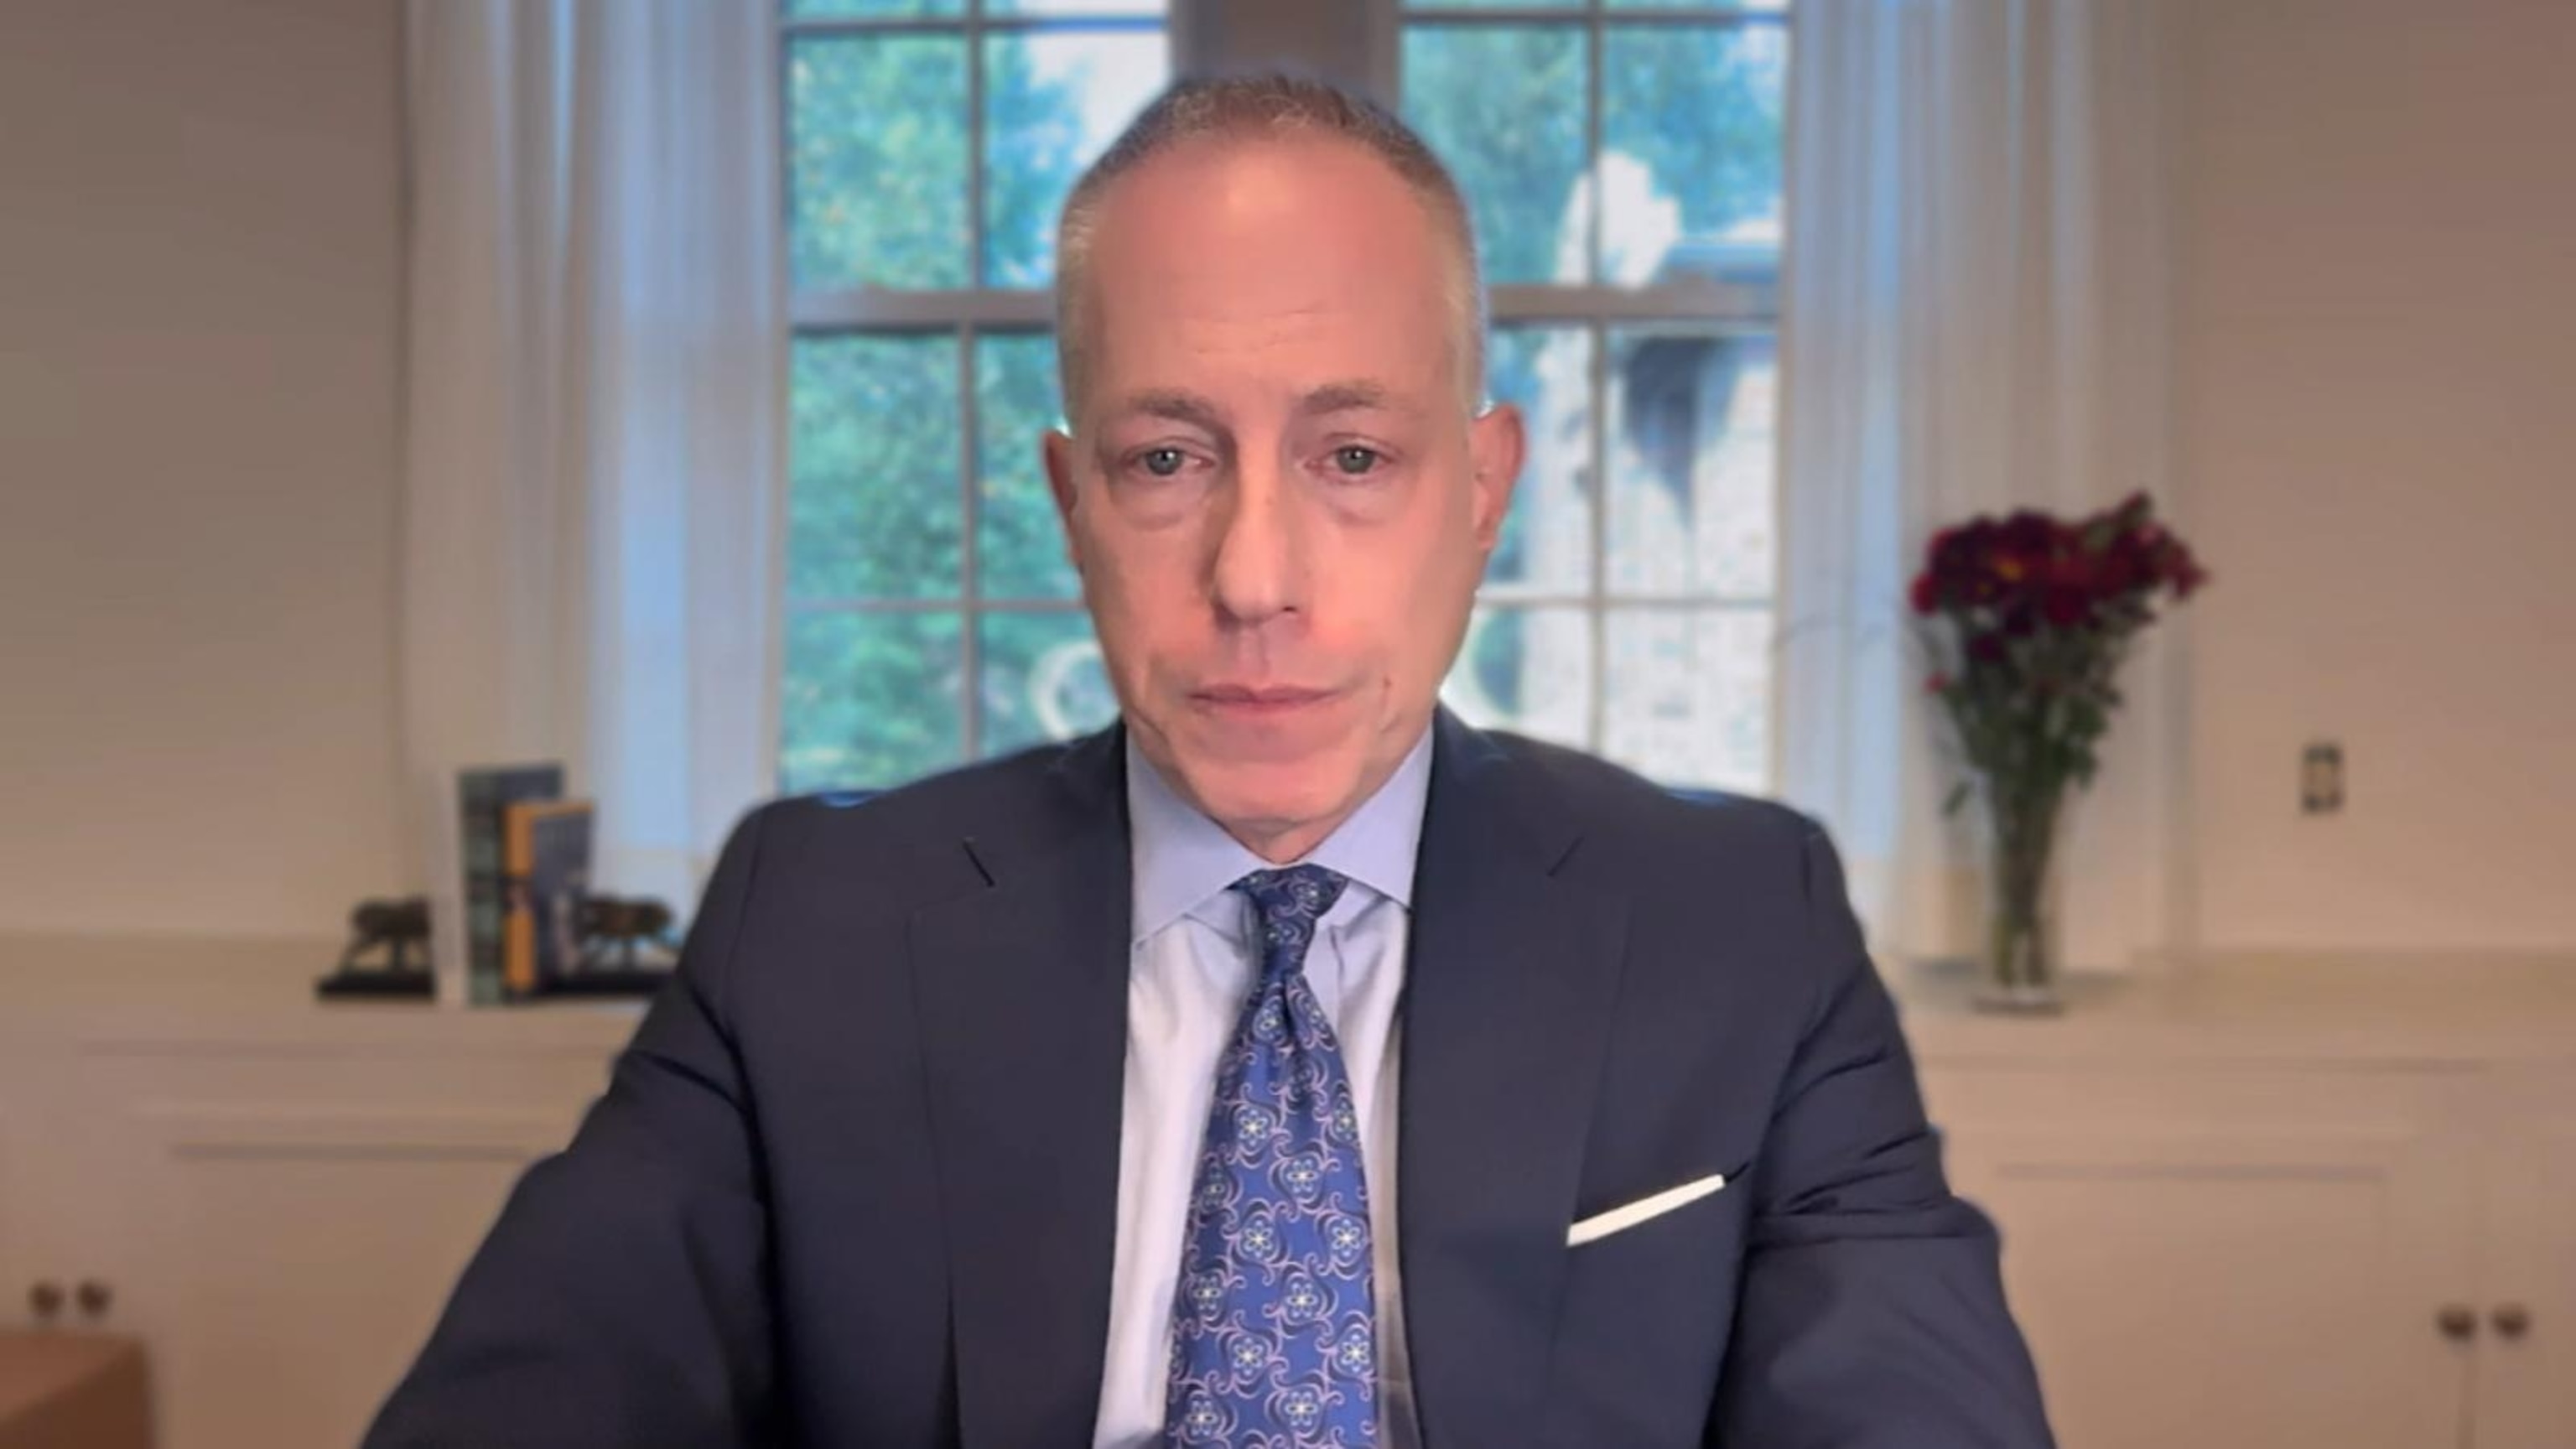
Former federal prosecutor on James Comey trial
- 2 days ago

4:53
Sen. Katie Britt on funding impasse
- 2 days ago
Playlist · 10 Videos